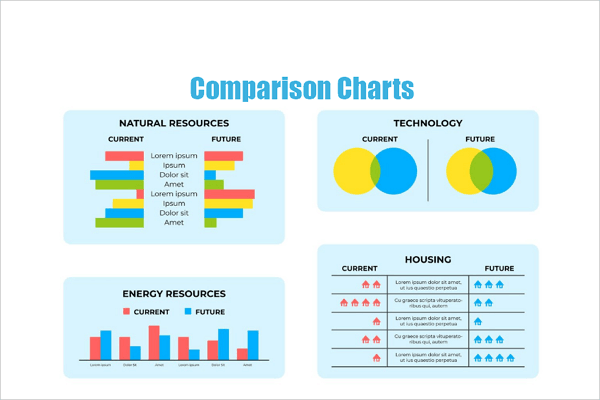
A flowchart is a visual way to show the steps, decisions, and direction of a particular process. It can make workflows, approval processes, customer journeys, onboarding sequences, and decision paths much easier to understand.
If you want anyone to follow a process without getting lost, knowing how to create a flowchart in PowerPoint can come in handy.
This guide walks you through various methods of creating one, such as SmartArt, manual shapes, ready-made templates, and AI-assisted tools, so you can pick the method that fits your process.
Common Symbols of Flowchart in PowerPoint
To create a flow diagram in PowerPoint, you need to know its common symbols and how to use them correctly. Using the right shape for each step ensures that your audience follows the diagram easily.
1. Start/End
The Start/End shape (usually an oval or a rounded rectangle) marks where a process begins or finishes. For example, you could use it for “Order Received” at the beginning or “Process Complete” at the end.
2. Process
A rectangle represents an action or task in a workflow. Examples include “Review Request,” “Check Inventory,” or “Send Invoice.”
3. Decision
A diamond represents a question or decision that creates different paths. For example, “Approved?” could lead to Yes and No branches.
4. Input/Output
This shape represents information entering or leaving a process. Examples are “Enter Customer Information” and “Generate Report.”
5. Connectors
Arrows and connecting lines show how one step leads to another. However, you should always label decision branches clearly and avoid unnecessary crossings. Clean connectors can make a complicated process much easier to understand.
How to Make a Flowchart in PowerPoint Using SmartArt
SmartArt offers a very quick way to make a flowchart in PowerPoint, especially when your process is simple and mostly linear.
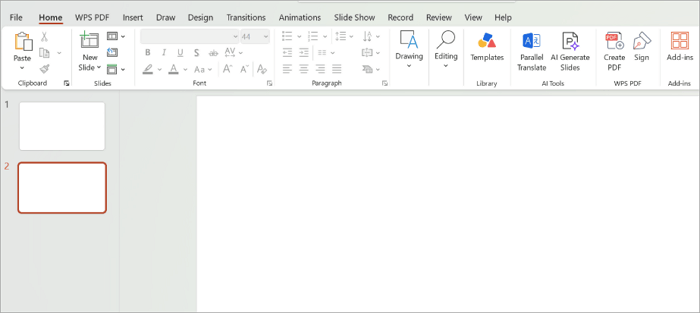
Step 1: Open your PowerPoint Presentation
Create a blank presentation or open an existing one.
Step 2: Open the SmartArt Menu
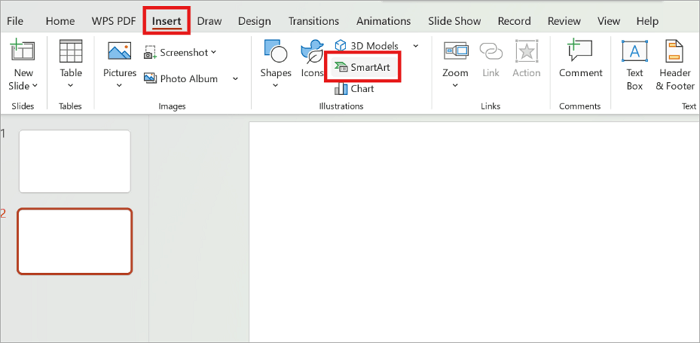
Go to the Insert tab and select SmartArt.
Step 3: Choose a Process Layout
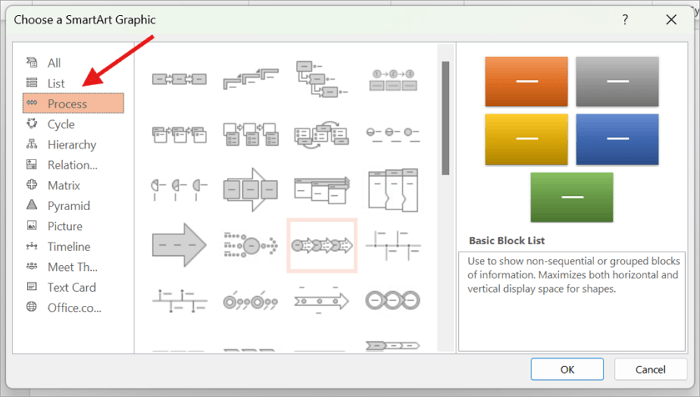
Select your preferred flowchart layout under the Process category and click OK.
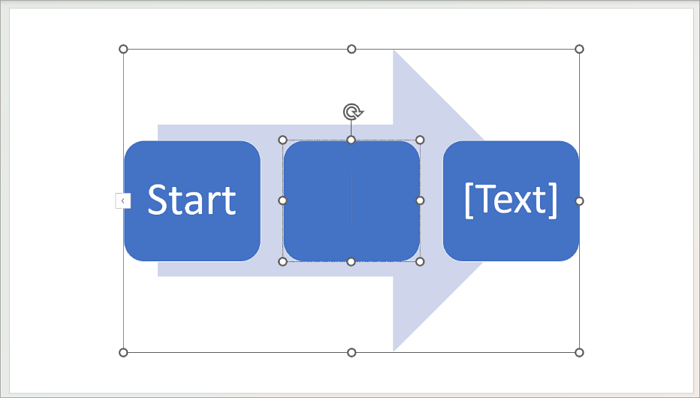
Step 4: Enter your Steps
Click into each shape and type a text that describes your step.
Step 5: Customize the Design
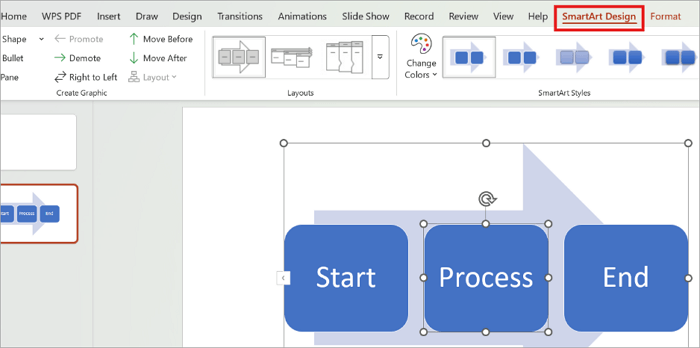
Use the SmartArt Design tab to adjust colors, add shapes, or switch styles.
How to Build a PowerPoint Flowchart Manually
If you need a more customized layout, you can build a flowchart in PowerPoint from individual shapes. But before you begin, write down the process and identify where decisions or branches occur. This prevents you from rearranging everything later.
Here’s how to build one using a simple purchase approval workflow:
Step 1: Insert a Start Shape
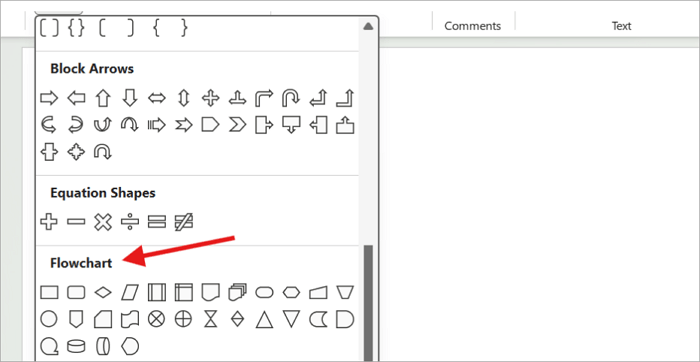
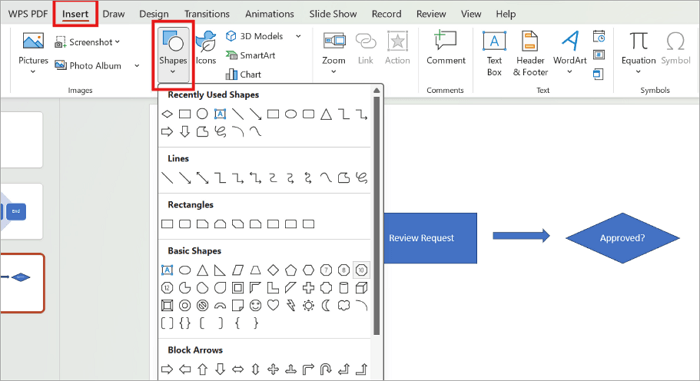
Go to Insert > Shapes > Flowchart and select the oval shape to signify the process start.
Step 2: Label the Start Shape
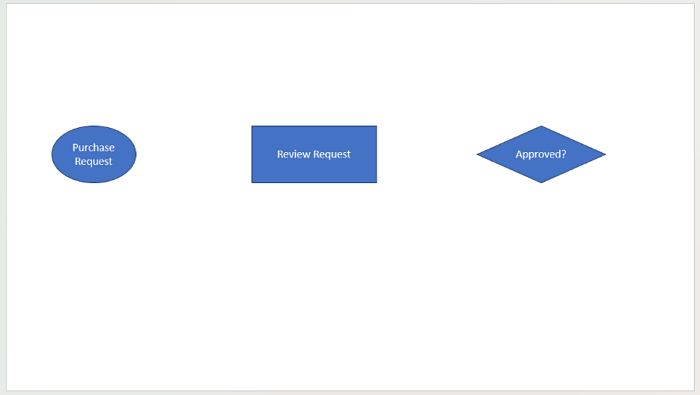
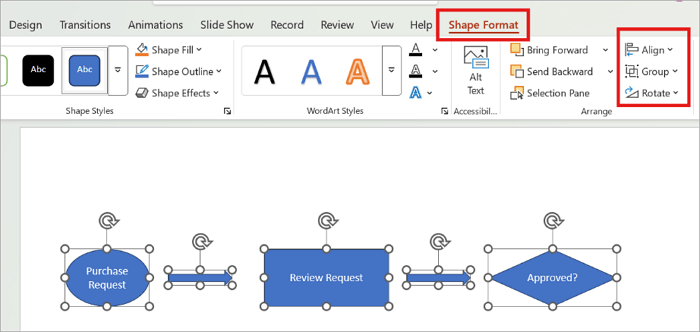
Click the shape and type “Purchase Request.”

Step 3: Add and Label Other Flowchart Shapes
Insert a Process rectangle labeled “Review Request” and a Decision diamond labeled “Approved?”
Step 4: Use Arrows or Connectors to Link Each Shape
Go to Insert > Shapes once again and choose your preferred option.
Step 5: Keep the Spacing Even
Select all the shapes on the slide and use Shape Format > Align or Group.
How to Start With a PowerPoint Workflow Template
If you already know your process and just don’t want to build the layout from scratch, a PowerPoint workflow template saves you the setup work. AiPPT.com offers editable templates that can provide a ready-made structure for PowerPoint and other presentation tools.
All you need to do is download the template and swap in your own steps.
Here are some AiPPT flowchart templates you may want to check out:
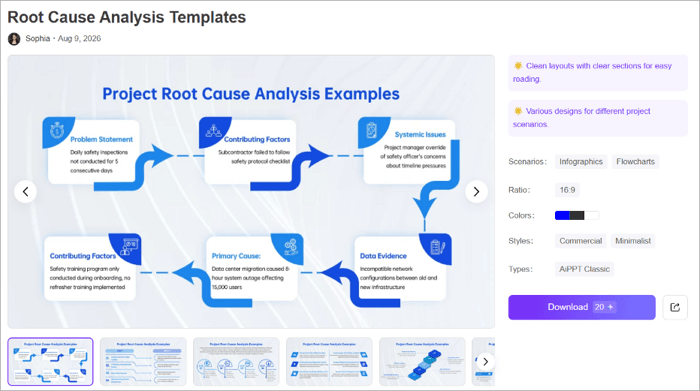
1. The Root Cause Analysis Templates
Best for: Teams presenting cause-and-effect analyses
This template uses a blue-and-white palette, geometric callout boxes, and numbered step indicators across circular diagrams, horizontal flowcharts, and dedicated “why” sections to break down systemic issues clearly.
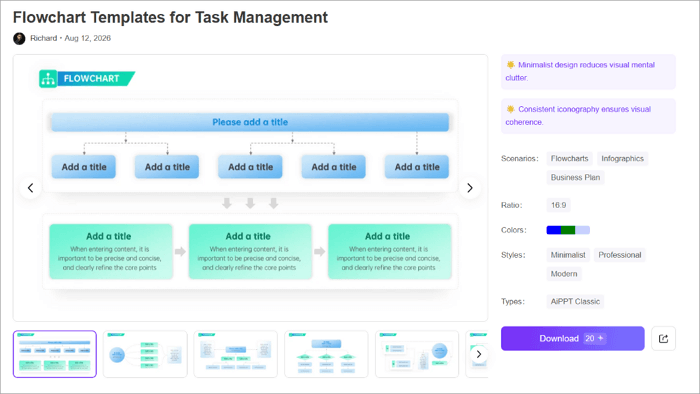
2. The Flowchart Templates for Task Management
Best for: Project planning, troubleshooting, or training
The template pack includes 10 flowcharts in different shapes and hierarchies, using a clean blue-and-green palette to map steps, spot bottlenecks, and simplify decisions. It is free to download and editable in PowerPoint or Google Slides.
How to Create a Flow Diagram in PowerPoint Using AI
AI tools such as AiPPT Flow can make it easier to turn a process into a clear presentation. Instead of building every step and connection manually, you can use the tool to structure your ideas and create a workflow diagram as part of your presentation.
AiPPT Flow lets you provide your process as a prompt or upload relevant material, then organize the content into a presentation. It can generate structured outlines, create workflow diagrams, and help you refine the resulting slides before presenting them.
Here’s how to create a flow diagram with AiPPT Flow:
Step 1: Sign in to AiPPT.com or create a new account.
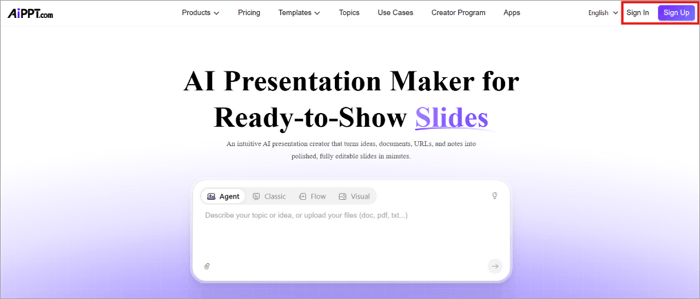
Step 2: Switch to Flow mode and describe your process in a prompt or upload relevant material.

Step 3: Review the generated process and select a template.
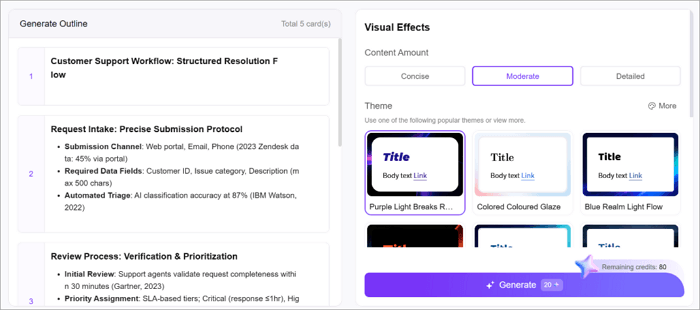
Step 4: Edit incorrect or missing information and adjust the layout, colors, and text where necessary.

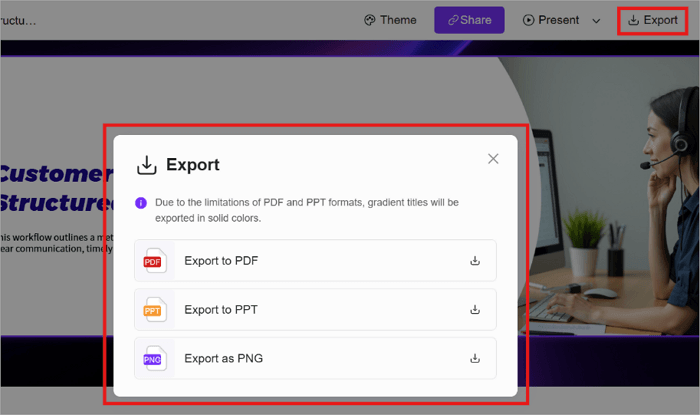
Step 5: Click Export to save the presentation in PNG, PPT, or PDF files.
Conclusion
Your flowchart should always be clear enough for your audience to follow without explanation. One simple way to test this is to ask someone unfamiliar with the process to follow it. If they get confused, your diagram may need a few adjustments.
Knowing how to create a flowchart in PowerPoint gives you several options. You can build one manually for full control, start with an AiPPT.com template for speed and structure, or use AiPPT Flow to turn your process input into an AI-assisted diagram faster.
FAQs on PowerPoint Flowchart
Whether you are working on a business presentation, a class project, or a workflow document, the following answers can help you choose the simplest approach to creating a PowerPoint flowchart.
1. What is the easiest way to make a diagram in PowerPoint?
The easiest way to make a flowchart in PowerPoint is usually with SmartArt. Open PowerPoint and follow these steps:
- Select Insert > SmartArt
- Choose the Process category
- Select a layout
- Enter your text to describe the steps
- Use SmartArt Design to adjust the appearance
2. Is SmartArt or Shapes better for a PowerPoint process flow?
It depends on complexity. SmartArt is faster and cleaner for simple, linear flows. Manual Shapes, on the other hand, give you full control over branching, decision points, and custom layouts, which comes in handy once your PowerPoint process flow involves more than one path or outcome.
3. How to draw flowcharts in PowerPoint using AI?
You can use AiPPT Flow to speed up the process. Here’s how to go about it:
- Open AiPPT Flow and enter your workflow or upload a file
- Describe the steps and decisions clearly
- Let AI generate the structure and visuals
- Then select a template
- Check every step and decision for accuracy
- Edit the design and content
- Export the finished presentation