A list of dates can tell you when things happened, but it doesn’t always show the bigger picture. Without a clear visual structure, your audience may have to work harder to understand how events and outcomes connect.
That is why you should know how to create a timeline in PowerPoint. With a timeline, you can organize information on events, milestones, deadlines, and project stages into a visual sequence that’s easy to follow.
In this guide, you’ll learn how to build one using SmartArt, templates, shapes, and project schedules, so you can choose the best method for your presentation.
Key Takeaways
- SmartArt is a quick choice for simple timelines with a few milestones.
- Templates provide ready-made designs that can save formatting time.
- Shapes give you more control when you need a custom layout.
- Project timelines should show phases, durations, deadlines, and key milestones.
- AiPPT.com can generate editable timeline slides from topics, text, and documents.
Types of Timeline in PowerPoint
The best timeline format for PowerPoint depends on the information you want to share with your audience. Here are the main types:
- Milestone timeline: It is useful for presentations where you only want to highlight major moments, such as launches, graduation, or approvals.
- Chronological timeline: It lays out events in the order they happened, making it useful when sequence is important, such as in a company’s history or product development.
- Project timeline: This timeline goes a step further by showing tasks, phases, deadlines, and milestones that overlap or run in parallel. It works well for project planning and progress updates.
How to Make a Timeline in PowerPoint with SmartArt
SmartArt offers an easy way to make timelines in PowerPoint. It features ready-made layouts that can turn a list of events into a visual sequence without having to draw every element yourself.
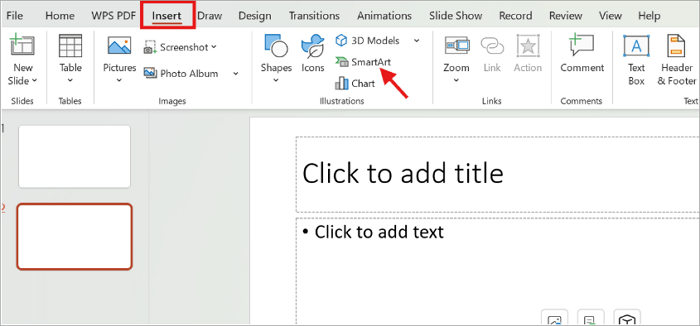
Step 1: Open SmartArt in PowerPoint
Select a slide in your presentation and go to Insert > SmartArt.
Step 2: Choose a Timeline Layout
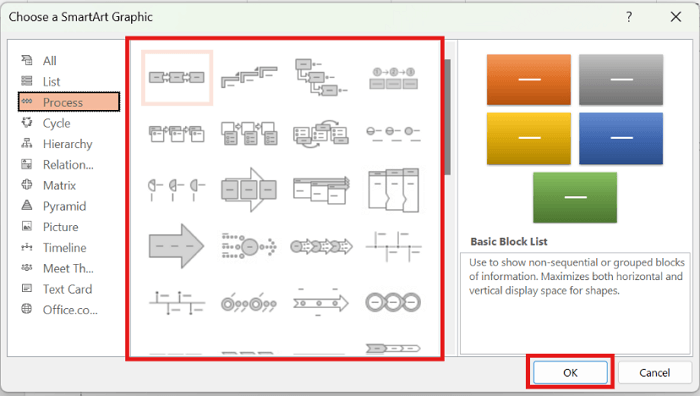
Click Process from the SmartArt categories and choose your preferred layout. Then, click OK.
Step 3: Type in Your Milestones
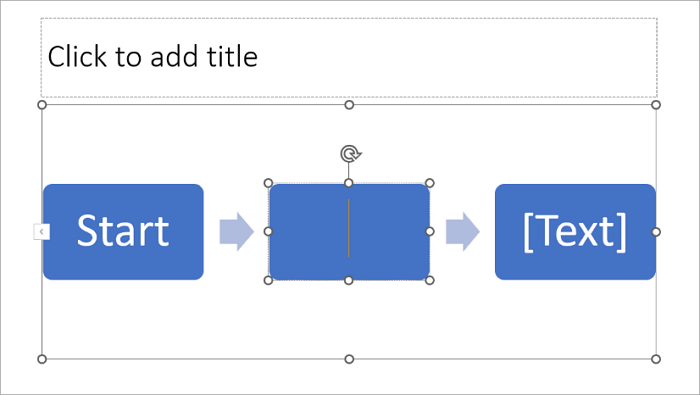
Click each placeholder and enter your dates or milestones.
Step 4: Add More Milestones
Go to SmartArt Design > Add Shape if you need to include more milestones.
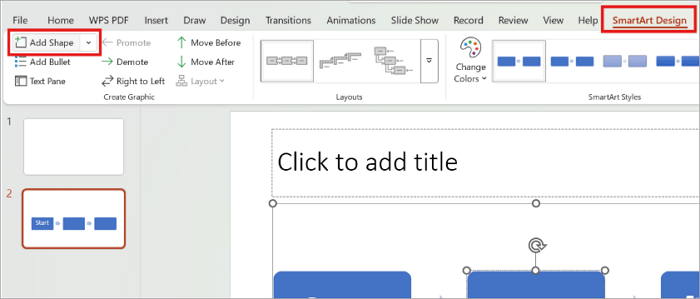
Note: Use the SmartArt Design and Format tabs to adjust colors, styles, and sizing.
How to Create a Timeline from PowerPoint Templates
Templates come in handy when you want to make a timeline in PowerPoint without designing every element from scratch. But before choosing one, consider how many milestones you need to display on the timeline.
Step 1: Find a Template in PowerPoint
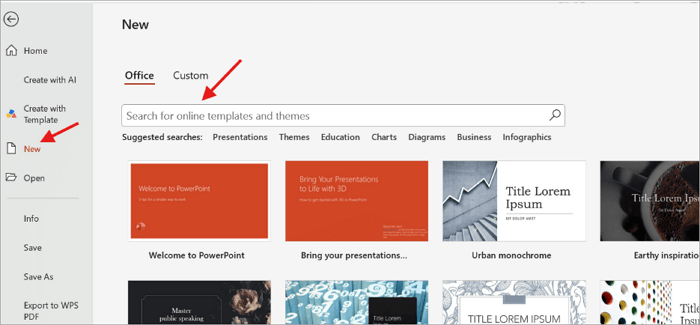
Open PowerPoint and go to File > New. Then, type “timeline template” into the search bar.
Step 2: Select Your Preferred Design
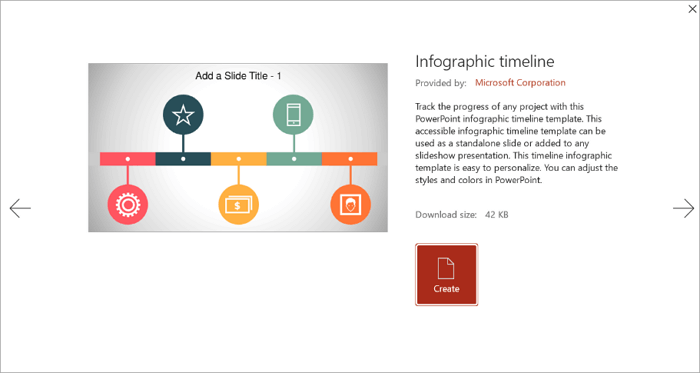
Preview a few options and pick one that matches the number of events you need.
Step 3: Enter Your Project Details
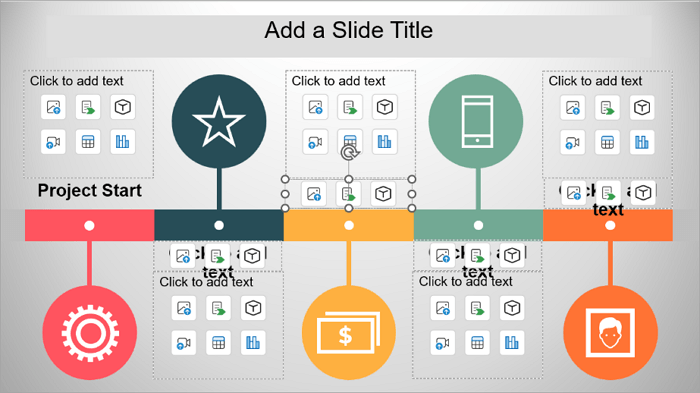
Open each placeholder and replace the sample dates and text with your information.
Step 4: Customize the Timeline
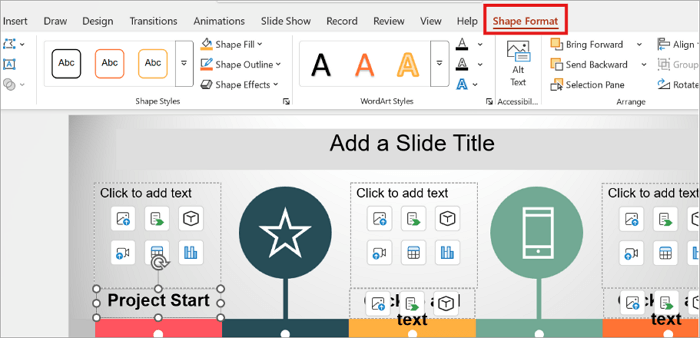
Use the Shape Format tab to adjust colors, fonts, icons, and spacing to match your branding.
How to Make a Timeline Manually With Shapes
Building a PPT timeline with shapes requires more effort, but it gives you greater control and flexibility. You can decide exactly where to place each milestone, how much space to give it, and how much information to display.
Step 1: Start with a Blank Slide
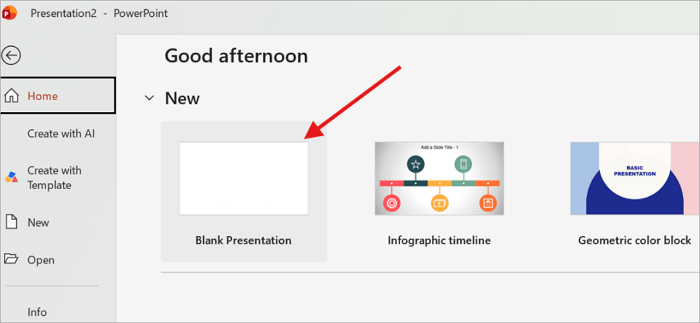
Open a blank presentation in PowerPoint.
Step 2: Create a Base Shape
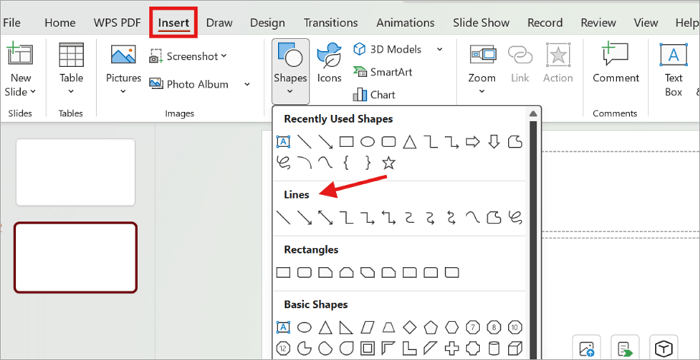
Go to Insert > Shapes and choose a line for the main timeline.
Step 3: Add Other Shapes to Represent Milestones
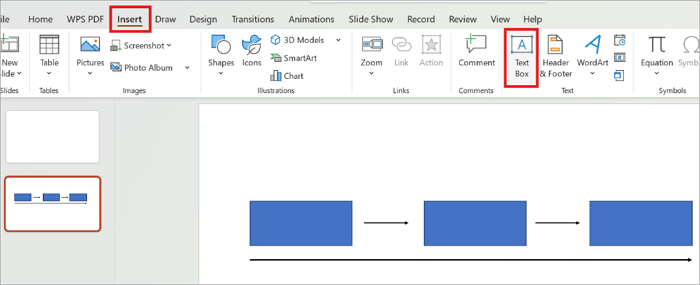
Select circles or rectangles and position each one along the base line. You can also add arrows to show direction.

Step 4: Add Text Boxes
Go to Insert > Text Box to insert new text boxes for dates and descriptions.
Step 5: Distribute the Text Evenly
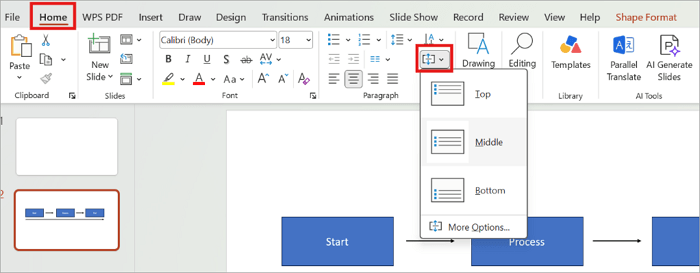
Select all elements and go to Home > Paragraph > Align to create consistent spacing.
How to Create a Project Timeline in PowerPoint
Unlike a simple milestone timeline, a project timeline needs to show when a task begins, how long it lasts, which phase it belongs to, and when a major milestone is reached.
Here’s how to build one with basic shapes, using a 4-week app launch as an example.
Step 1: Insert a Horizontal Axis
Draw a horizontal line across the slide. Then add text boxes on top of it and label each week.

Step 2: Add a Bar for Each Task
Go to Insert > Shapes > Rectangle and draw one bar per task below the axis.
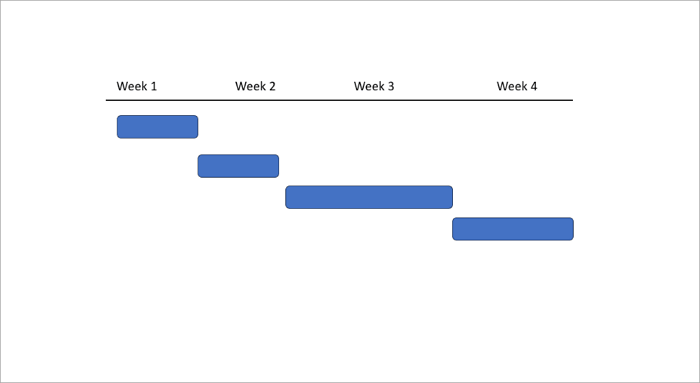
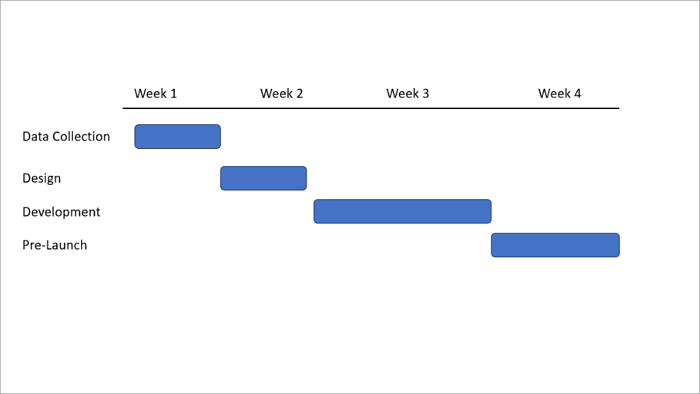
Step 3: Stack and Label the Bars
Line up each bar in its own row under the axis, one row per task, and add a text box to the left of each bar naming the task.
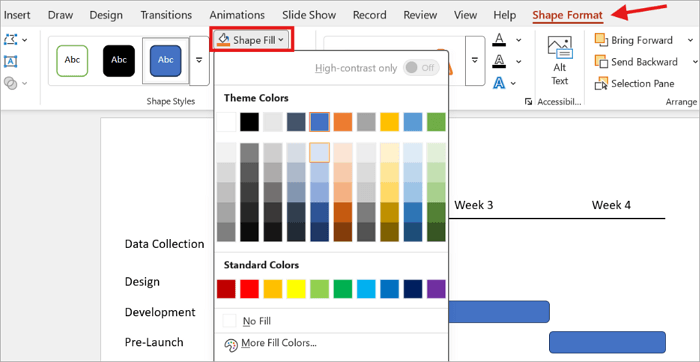
Step 4: Color-Code the Bars
Select each bar and use Shape Format > Shape Fill to give each task its own color.
How to Make a Timeline in PowerPoint with AiPPT.com
There is a much quicker way to make a timeline in PowerPoint with AiPPT.com. This AI-powered presentation tool helps you turn ideas, documents, URLs, and notes into polished, fully editable slides in minutes.
Depending on your presentation goal, AiPPT.com lets you:
- Describe your timeline and structure it for you.
- Upload files containing dates, milestones, or project details.
- Adjust generated text, layout, and timeline elements.
- Export your finished timeline as a PowerPoint file.
When creating timelines on AiPPT.com, the Flow mode comes in handy. Here’s how to quickly generate one:
Step 1: Go to AiPPT.com to sign up, or sign in if you already have an account.

Step 2: Select Flow mode and type a prompt or upload a document describing your timeline.
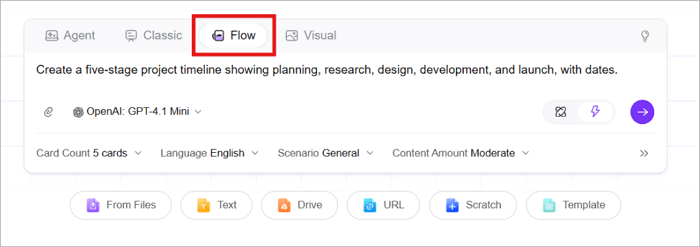
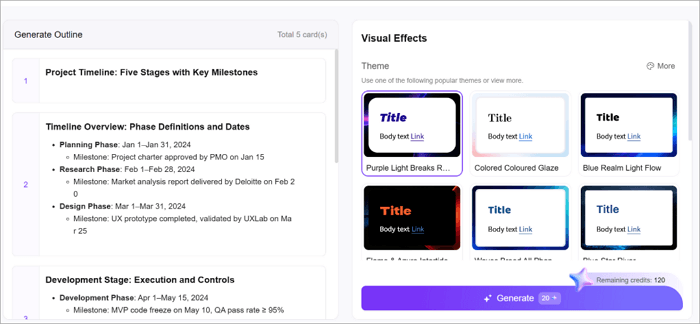
Step 3: Review the generated outline and click Generate to continue.
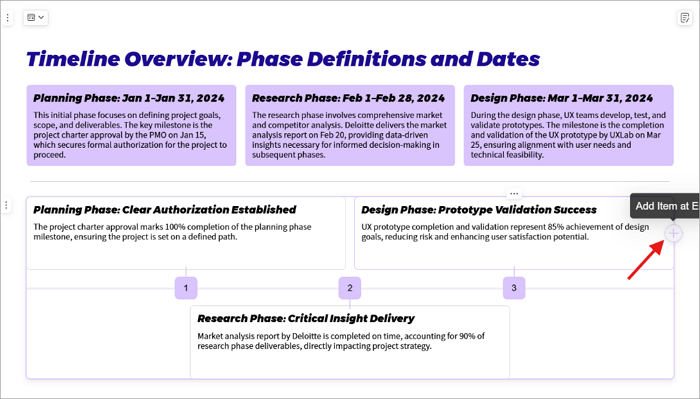
Step 4: After generating, click any milestone to change its text or the + button to add a new milestone.
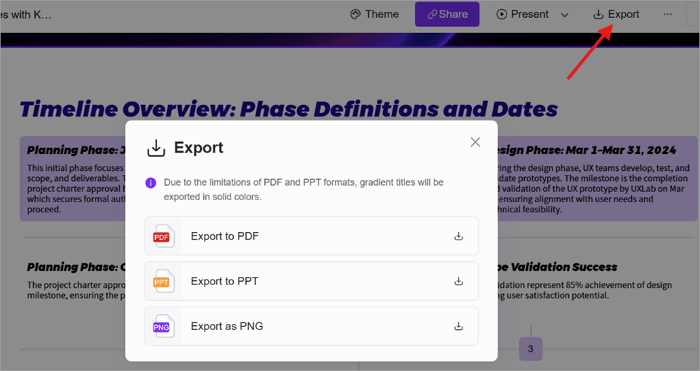
Step 5: Click Export to save the timeline as a PPT file.
Conclusion
The right timeline can help you create a story that your audience can follow at a glance. Knowing how to create a timeline in PowerPoint helps you choose the right approach, whether you need simple milestones, detailed project schedules, or a more customized design.
SmartArt may be all you need for simple timelines, while shapes or templates can offer more flexibility. If you want to reduce the manual work to almost zero, AiPPT.com can come in quite handy.
Before you start designing, however, decide what your audience needs to understand first, then choose the timeline format that communicates it most clearly.
Learn More About PPT Timeline
Here are some common questions other users ask when they want to insert a timeline in PowerPoint.
1. How to do a timeline in PowerPoint with dates?
To create a timeline in PowerPoint with dates:
- Open a blank presentation.
- Go to Insert > SmartArt > Process.
- Select a timeline layout.
- Enter each date and its corresponding event.
- Arrange the dates and remove unnecessary descriptions.
- Adjust the colors, fonts, and spacing.
2. How to create a Gantt timeline in PowerPoint?
A Gantt timeline needs task duration and overlap, so build it on a table grid instead of loose shapes. Here’s how to go about it:
- Go to Insert > Table.
- Add one row per task and one column per week.
- Shade each task’s active-week cells from Table Design > Shading.
- Go to Insert > Shapes to add a diamond shape in the deadline cell.
- Color-code each task’s bars to show overlap.
3. How do you create a timeline on PowerPoint from Excel data?
Here’s how to quickly create a timeline using data from Microsoft Excel:
- Sort your data into columns for dates, events, or project tasks.
- Open PowerPoint and go to Insert > Chart.
- Select a suitable chart type, or copy an existing chart from Excel into your slide.
- Adjust the formatting after importing.