Presentations, especially those related to sales, often show how different products contribute to total revenue.
Instead of presenting the information in a table full of numbers, you can use a pie chart to make these proportions easier to understand at a glance.
This guide explains how to make a pie chart in PPT, as well as how to customize its appearance, use existing Excel charts, and add animations.
Key Takeaways
- Insert a 2-D pie chart and replace the sample data with your own figures.
- Use clear labels, contrasting colors, and simple formatting to improve readability.
- Choose data that represents parts of a single whole.
- Use animations and appropriate slide layouts to present your findings effectively.
How to Create and Customize a Pie Chart in PowerPoint
PowerPoint lets you create pie charts directly from your presentation and customize them to suit your data and slide design. You can enter your figures, adjust the chart’s appearance, and add labels to make the information easier to understand.
Here’s how to insert a pie chart in PowerPoint.
Step 1: Insert a Pie Chart
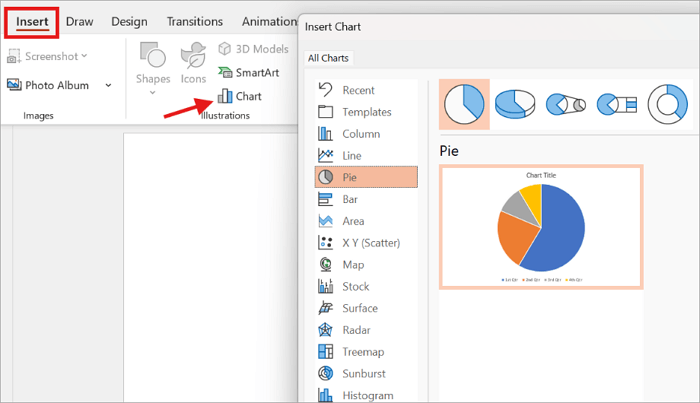
Select the slide where you want to place the chart. Then go to Insert → Chart → Pie, select the standard 2-D Pie option, and click OK.
The 2-D pie chart is a good starting point because it is usually easier to read than decorative 3-D variations.
Step 2: Enter Your Data
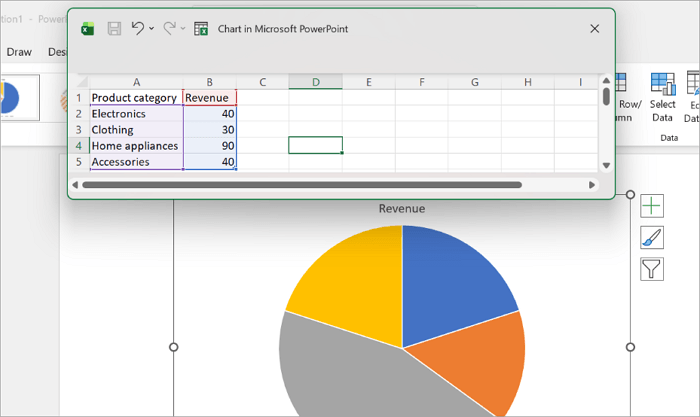
PowerPoint automatically opens an Excel-style spreadsheet containing sample categories and values. Replace the existing information with your figures.
As you enter your data, the chart calculates slice proportions automatically so you don’t need to convert every value into a percentage manually. Check that your selected data range includes all categories and their corresponding values.
Step 3: Add Labels and Percentages
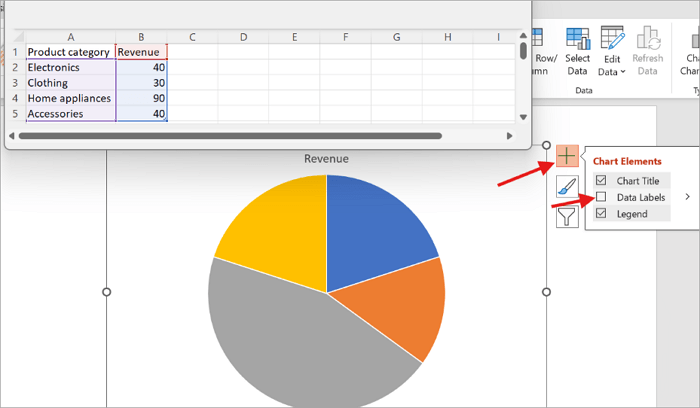
Labels help your audience identify each slice without guessing. To enable data labels, select the chart, click the Chart Elements (+) button beside it, and tick the Data Labels box.
Right-click a label and select Format Data Labels to display category names, percentages, or both.
Step 4: Customize the Chart’s Appearance
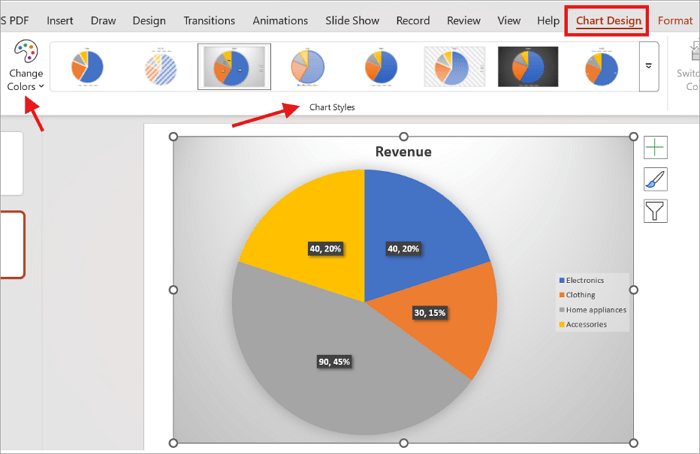
Select the chart and open the Chart Design tab. Use the Chart Styles and Change Colors options to explore different appearances.
Avoid unnecessary shadows, effects, and too many similar colors. A simple design is usually enough to communicate the figures more effectively.
Step 5: Review and Update Your Chart
Before presenting, ensure that the labels match the correct categories and the proportions reflect your original figures.
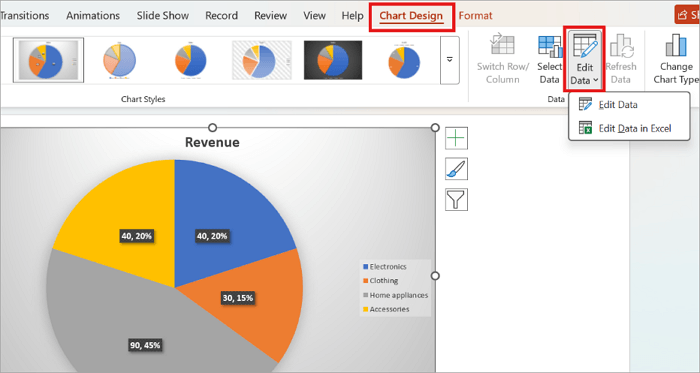
If a value changes, select the chart and go to Chart Design → Edit Data to update it.
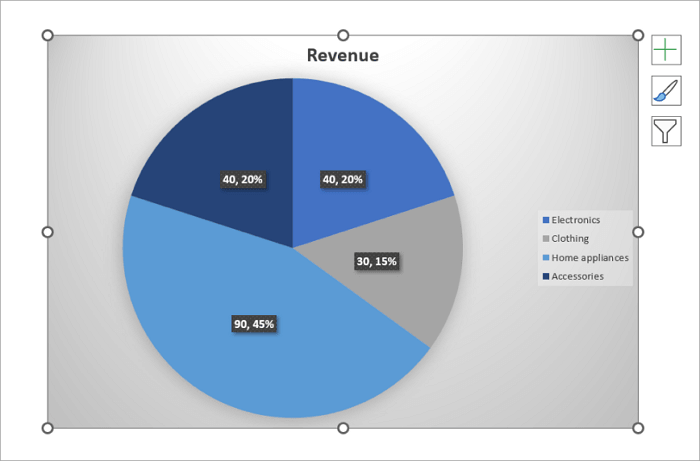
Your pie chart may look like this after editing it.
How to Use an Existing Excel Pie Chart in PowerPoint
If you already have a pie chart in Excel, you can transfer it to PowerPoint without creating a new one.
Here’s how to go about it:
Step 1: Open the Excel workbook and select the pie chart.
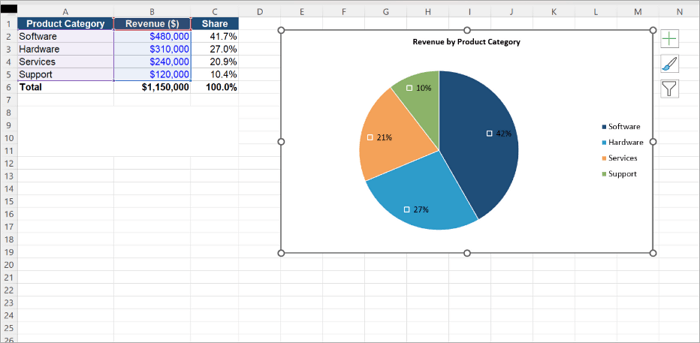
Step 2: Press Ctrl + C to copy it.
Step 3: Open your PowerPoint presentation and select the destination slide.
Step 4: Right-click the slide and choose your preferred paste option.
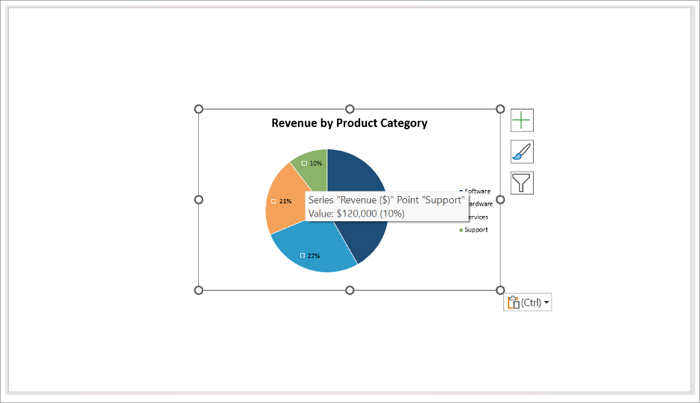
PowerPoint offers three paste options:
- Embed Chart: Stores an editable copy of the chart and its data inside the presentation. You can modify it without needing the original workbook.
- Link Chart: Maintains a connection to the Excel workbook, so any changes you make to the source data are reflected in PowerPoint.
- Paste as Picture: Inserts a fixed image of the chart. You can resize it, but you cannot edit its underlying data.
Embedding is convenient when sharing presentations externally, while linking works well for reports that require regular updates. Note that moving or renaming the source workbook can break the link.
How to Animate a Pie Chart in PowerPoint
After you make a pie chart in PowerPoint, you may want it to appear gradually while presenting, especially when explaining multiple categories individually.
This is where animation comes in handy. Here’s how to apply it to your pie chart:
Step 1: Select the Pie Chart
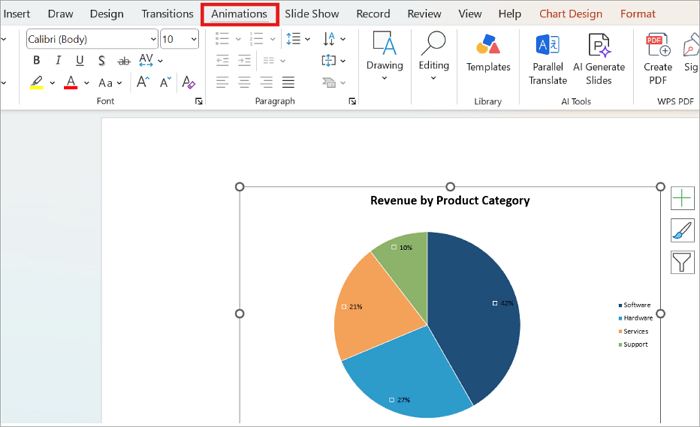
Click the completed chart and open the Animations tab.
Step 2: Apply the Wheel Animation
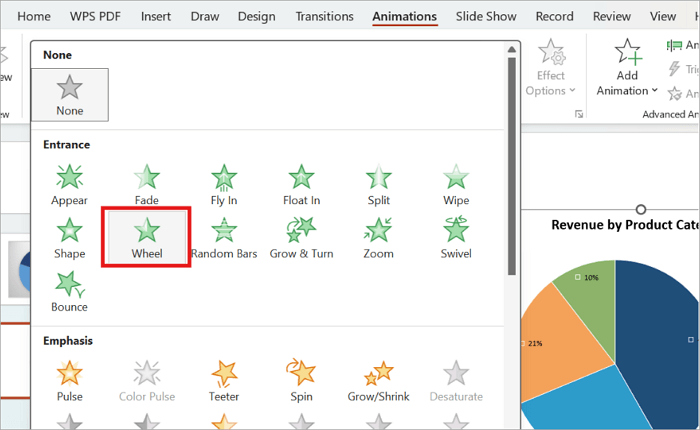
Choose Wheel from the entrance effects. This creates a circular reveal.
Step 3: Adjust the Animation Sequence
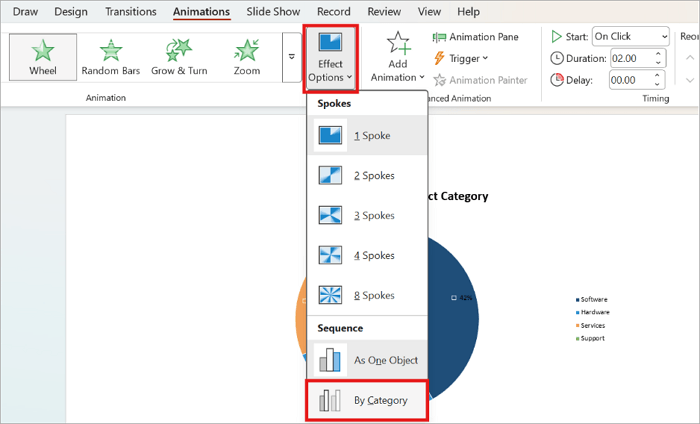
Open Effect Options and select By Category, if available, to display the slices individually.
Step 4: Set the Timing
Choose On Click if you want to control when each animation starts. Select After Previous to let it play automatically after the preceding effect.
Preview the result in Slide Show mode to make sure the animation flows naturally.
Create Pie Chart Slides Faster with AiPPT.com
If you want to create a presentation containing pie charts without designing every slide manually, AiPPT.com offers a convenient alternative.
It offers AI-powered slide generation, customizable layouts, and chart editing features that simplify the design process.
AiPPT’s features include:
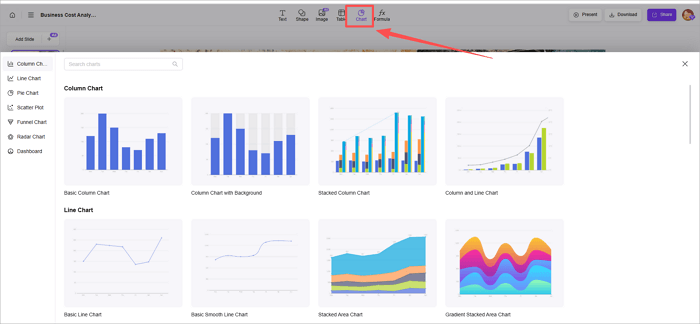
1️⃣ AiPPT.com: This lets you generate a presentation from a topic or source materials. Once the slides are ready, select Chart to add a pie chart. You can choose the chart type and adjust its data, size, and placement. For example, you can generate a sales presentation and add a chart showing revenue distribution across four product categories.
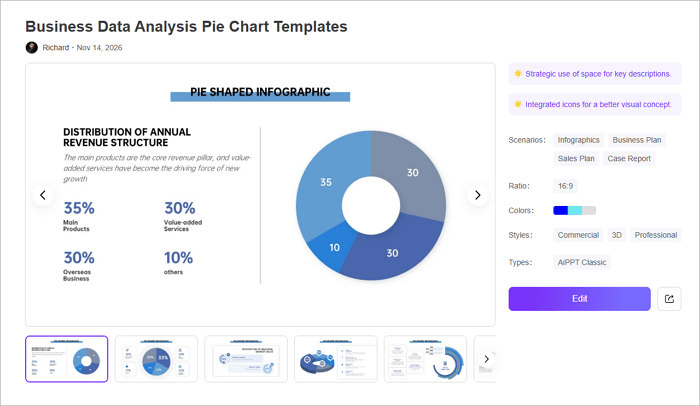
2️⃣ AiPPT Pie Chart Templates: You can explore the Business Data Analysis Pie Chart Templates. They offer ready-made pie chart layouts with coordinated colors, icons, and supporting text areas. They’re useful when you need a polished chart slide without building the design from scratch.
Conclusion
Clear data visualizations make it easier to communicate findings during sales meetings, budget reviews, and classroom presentations.
When adding a pie chart to your presentation, ensure that its design helps viewers recognize the most important proportion without studying every number. This is what makes the chart an effective visualization tool.
Now that you know how to make a pie chart in PPT, review your next chart to confirm that its labels, colors, and proportions clearly communicate the intended message.
FAQs About Pie Charts in PowerPoint
Here are answers to some common questions you may have when working with pie charts in PowerPoint.
1. How do I rotate a pie chart in PowerPoint?
To change the position of the slices:
- Right-click any slice of the pie chart.
- Select Format Data Series.
- Find the Angle of First Slice option in the formatting pane.
- Enter your preferred angle, such as 90 or 180 degrees, and press Enter.
2. How do I make a doughnut chart in PowerPoint?
You can create a doughnut chart in PPT using a process similar to the one for creating a pie chart.
- Open your slide and select Insert → Chart.
- Choose Doughnut from the chart categories.
- Click OK to insert the chart.
- Replace the sample information in the Excel spreadsheet with your data.
3. Can I create a pie chart with more than one data series?
No. A standard pie chart supports only one data series because all its slices represent parts of a single whole.
If you want to compare multiple data series, consider using a doughnut chart with separate rings or a different chart type, such as a clustered column chart.