If you’ve tried comparing ideas with plain text on a presentation slide, you know how difficult it can be. A Venn diagram solves this problem by using overlapping circles to show similarities, differences, and shared characteristics.
This article walks you through how to make a Venn diagram on Google Slides using manual methods and ready-made templates.
It also explores AI-assisted options from AiPPT.com so you can choose the method that best fits your presentation workflow.
Key Takeaways:
- A Venn diagram illustrates the relationships, similarities, and differences between ideas.
- You can quickly create Venn diagrams in Google Slides by overlapping shapes.
- Templates and ready-made visual elements can streamline the design process.
- AiPPT Flow and AiPPT Agent help you create and refine presentation visuals—more efficiently.
What Is a Venn Diagram and When to Use It?
A Venn diagram is a visual made up of overlapping circles that represent different groups, ideas, or concepts.
Each circle represents one category, while the overlapping areas show what those categories have in common. The separate areas highlight characteristics that belong only to one group.
Venn diagrams can help explain comparisons in many situations, including:
- Business presentations: Compare customer segments and show shared behaviors.
- Education: Explain the similarities and differences between scientific concepts.
- Marketing: Compare target audiences, products, or competitors.
- Strategy and operations: Show relationships between business strategies or processes.
How to Make a Venn Diagram in Google Slides Step by Step
Although there is no dedicated tool, you can easily make a Venn diagram on Google Slides using shapes. This method gives you control over the size, position, colors, and text.
Step 1: Open Google Slides and Create a New Slide
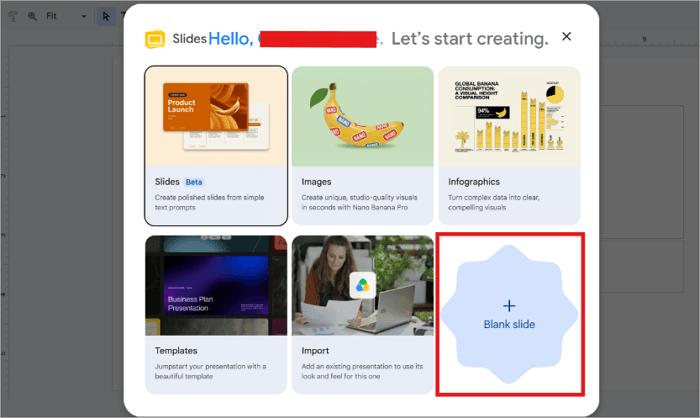
Create a new presentation or open the presentation where you want to add the diagram. Then, choose a blank slide.
Step 2: Insert Circles Using Shapes
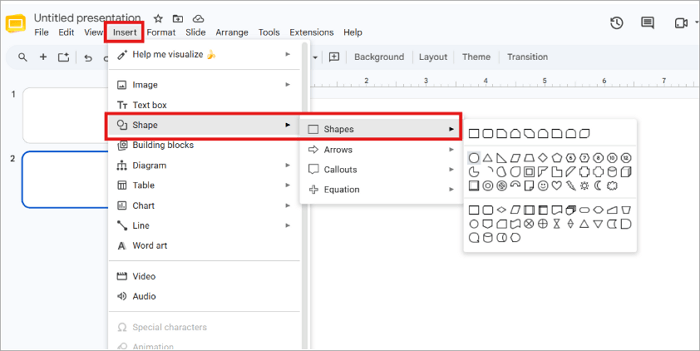
From the top menu, click Insert > Shape > Shapes and select Oval. Click and drag on the slide while holding Shift to create a perfect circle.
Step 3: Duplicate and Arrange the Circles
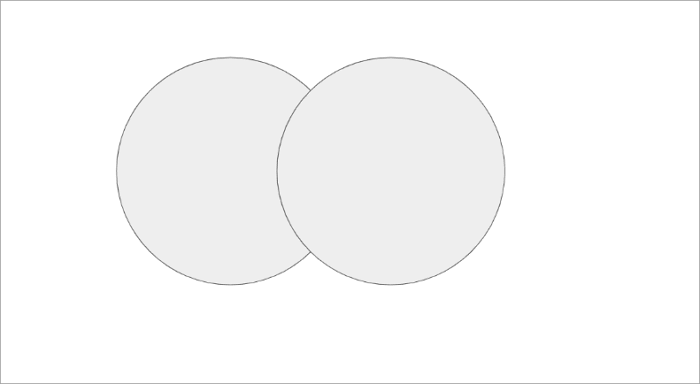
Instead of drawing another circle manually, select the first one and press Ctrl/Cmd + D to make a duplicate. Then, move the duplicate so that the two circles overlap and the shared area is large enough for your central information.
Step 4: Adjust Transparency and Colors
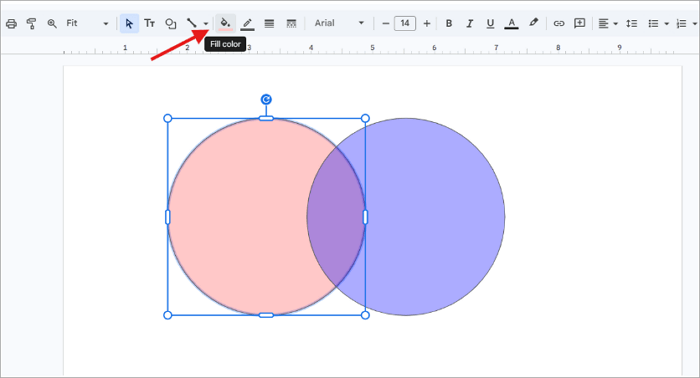
Select each circle and use Fill color to choose your preferred colors. Then use the Custom option to reduce the transparency so the overlapping section remains visible. Always choose two or three readable colors that fit your presentation’s palette.
How to Add a Venn Diagram Using Templates
Templates come in handy for creating Venn diagram slide presentations without manually adjusting shapes and formatting. With templates, you can skip the whole design process and get professional results more quickly.
AiPPT Flow includes ready-made toolkits for diagrams, charts, infographics, and visual elements, with Venn diagrams among its more than smart diagram types. Instead of building shapes one at a time, you drag these diagrams straight onto your slides.
Here’s how to add a Venn diagram using AiPPT Flow:
Step 1: Go to AiPPT.com and choose a preferred method to sign in or sign up.
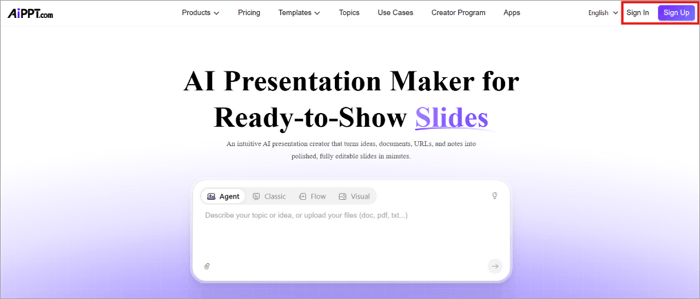
Step 2: Type in a prompt describing the Venn diagram presentation you want to generate. Alternatively, you can upload a document or URL to get started.

Step 3: After choosing a theme, open the Smart Diagrams menu from the right panel and select Venn Diagram.
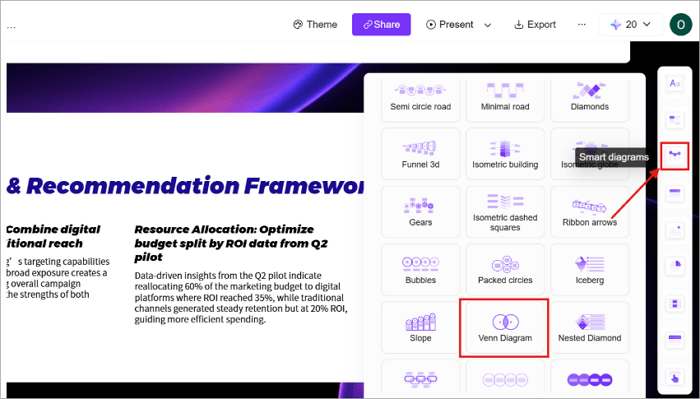
Step 4: Drag the Venn diagram onto your slide, then edit the circle labels and overlap text to match your content.
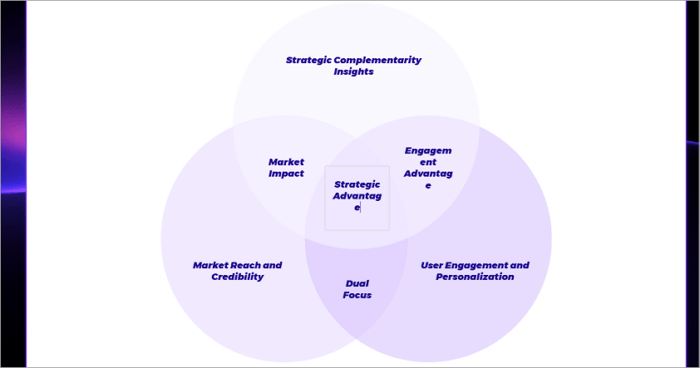
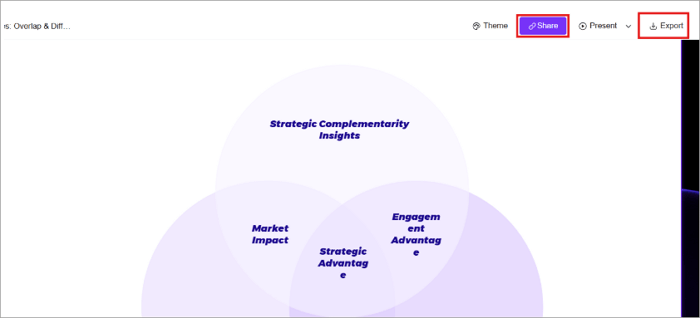
Step 5: Use the Share or Export option to download your presentation after customization.
How to Add a Venn Diagram Template Using AI
If you know what you want the diagram to communicate but do not want to design it manually, AiPPT Agent offers a conversational approach to creating a Venn diagram. Instead of building Venn diagrams yourself, AiPPT Agent lets you:
- Describe the comparison you need
- Generate the requested visual element
- Refine the result through follow-up messages
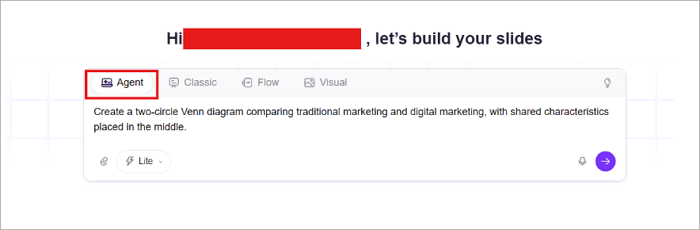
For example, you could ask for a two-circle Venn diagram comparing traditional marketing and digital marketing, with shared characteristics placed in the middle.
Here’s how to create a Venn diagram in Google Slides using AiPPT Agent:
Step 1: Sign in or sign up on AiPPT.com.
Step 2: Switch to Agent mode and describe the Venn diagram you want in the chat.
Step 3: Answer the required questions and click Submit.

Step 4: Review the outline and the generated Venn diagram. Then, ask the AiPPT Agent to adjust the design, wording, or arrangement if needed.
Common Mistakes When Creating Venn Diagrams
People make several common mistakes when creating Venn diagrams, making them difficult to understand. Watch out for these common mistakes and learn how to avoid them:
1️⃣ Too much text: Keep labels short so viewers can understand the diagram at a glance.
2️⃣ Too many circles: More circles create more intersections, which can quickly become confusing.
3️⃣ Poor colors: Low-contrast or overly bright colors can make text and overlaps difficult to read.
4️⃣ Bad spacing: Uneven circles or cramped labels can make the slide look unfinished.
5️⃣ Wrong use case: Do not force a Venn diagram onto information that would work better as a chart, process diagram (flowchart), or timeline.
Conclusion
Audiences can process a well-placed diagram faster than a paragraph of comparison text, which is why Venn diagrams keep showing up across business, education, and marketing decks.
When you create a Venn diagram in Google Slides, keep the structure simple, make the overlap obvious, and use short labels.
If manual formatting takes too much time, get started with templates and AI-assisted tools such as AiPPT Flow and AiPPT Agent, which can help you reach a polished result faster.
FAQs on Venn Diagram Slide
Still have questions about building a Venn diagram for Google Slides? You’ll find the answers below.
1. What is the easiest way to create a Venn diagram?
The easiest method for creating a Venn diagram in Google Slides depends on how much control you need.
For a simple diagram, use Google Slides’ oval shapes, duplicate them, overlap the circles, and adjust transparency. But if you want to save design time, a ready-made template or a visual tool such as AiPPT Flow can provide a more polished starting point.
2. How do I create a Venn diagram in Google Slides?
Here’s how to create a Venn diagram in Google Slides:
- Open your presentation and create a blank slide.
- Then select Insert > Shape > Shapes > Oval.
- Draw a circle while holding Shift.
- Select the circle and press Ctrl/Cmd + D to duplicate it.
- Then, overlap the copies and reduce their transparency.
- Finally, add text boxes for the labels and adjust the colors, spacing, and borders to match your slide design.
3. How do I make a 3-circle Venn diagram in Google Slides?
Need to make a 3-circle Venn diagram? Here’s how to go about it quickly:
- Create one perfect circle by selecting Insert > Shape > Shapes > Oval.
- Duplicate it twice by pressing Ctrl/Cmd + D so you have three equal circles.
- Arrange them so all three overlap in the center.
- Then adjust their transparency and colors.
- Add text boxes to the individual sections and the central overlap, keeping the labels short enough to remain readable.