Individuals and teams use tables in PowerPoint for various purposes, such as comparing products, presenting prices, organizing project details, displaying financial data, and sharing schedules or feature lists.
You might know how to make a table in PowerPoint, but formatting is what makes the information easy to read and understand during a presentation.
This guide explains how to create a PowerPoint table, customize its layout, and improve its appearance. You will also learn how to create table-based slides faster with AiPPT Agent.
Key Takeaways
- Insert tables directly into PowerPoint slides using several methods.
- Add, delete, merge, and resize cells as needed.
- Improve table readability with colors, borders, and alignment.
- Make dense tables easier to read.
- Import Excel data when working with existing spreadsheets.
- Use AiPPT Agent to generate and refine table-based presentation slides.
How to Create a Table in PowerPoint
PowerPoint includes built-in tools for creating and formatting tables. This means you can build one directly on your slide, regardless of what you want to achieve.
Here is how to insert a table in PowerPoint:
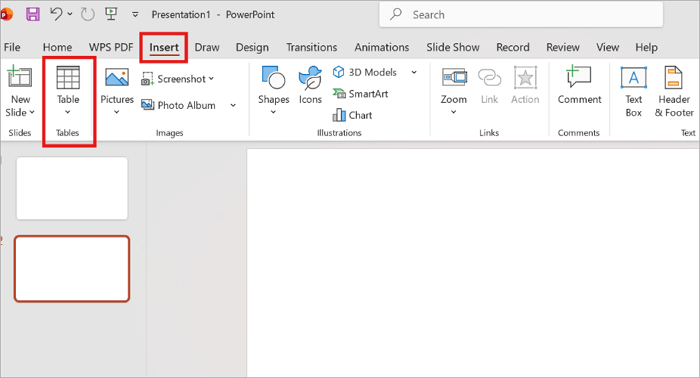
Step 1: Open your presentation and select the slide where you want the table. Click Insert → Table on the ribbon.
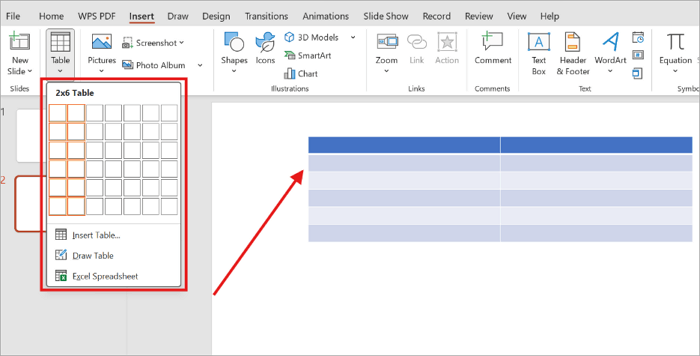
Step 2: Move across the grid to select how many rows and columns you need. Then click to insert the table.
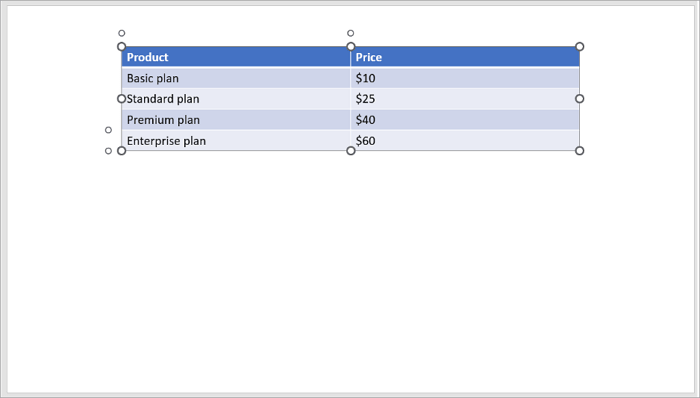
Step 3: Click each cell and type your text, numbers, or labels. Use the Tab key to move between table cells.
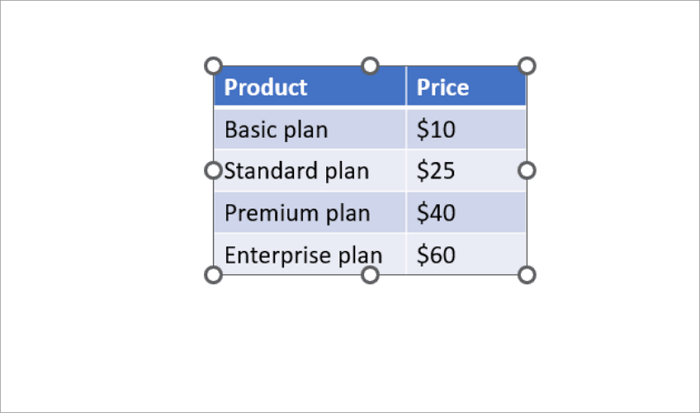
Step 4: Select the table border and drag a corner handle to adjust its overall size. Drag individual row or column boundaries to change their dimensions.
After creating your table, you can further customize it to fit your content.
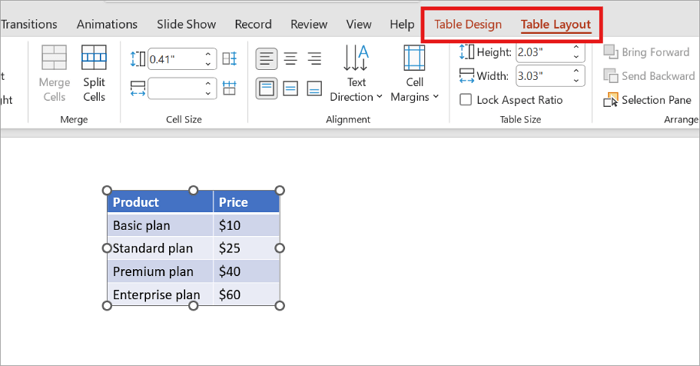
On the Table Layout tab, you can:
- Add or delete rows and columns.
- Use Distribute Rows and Distribute Columns to even out sizes.
- Merge cells for a wide heading, or split them to separate grouped information.
- Change text alignment and cell margins.
On the Table Design tab, you can:
- Apply a ready-made table style.
- Change shading and borders.
- Turn on Header Row so the top row stands out.
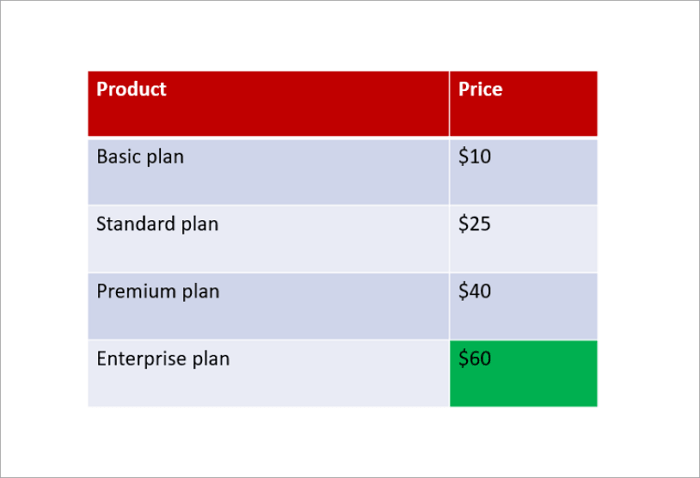
If you need more control over your table, select Draw Table from the Insert → Table menu to draw individual cells. Alternatively, copy data from Excel and paste it into PowerPoint if you have already prepared a spreadsheet.
How to Make PowerPoint Tables Look Better
To format a table in PowerPoint, you need to pay attention to how your audience will read the information it contains during a presentation.
Use these practical tips to improve the look of your PowerPoint tables:
- Keep borders or gridlines subtle and use them only when they help separate information.
- Apply a contrasting fill or bold text to distinguish the header row.
- Use consistent colors in your table and presentation.
- Highlight key values to draw attention to important figures in the table.
- Leave enough white space between the text and borders.
- Replace lengthy explanations with concise phrases wherever possible.
- Choose fonts that are readable even when projected onto a screen.
- Give each column enough room for its content without wasting space.
- Use icons only when they make information easier to scan. For instance, checkmarks can help distinguish available features in a product comparison.
Keep in mind that formatting tables in PowerPoint helps you create a visual hierarchy and not decorate your slides. If your audience needs a lot of time to understand the table, remove less important details or split the information across multiple slides.
Create PowerPoint Tables Faster with AiPPT Agent
Building tables in PPT works well for small datasets, but the process can take longer when you need several comparison slides or have information scattered across different files.
AiPPT Agent provides a faster way to organize that content into a presentation. Instead of arranging every element yourself, describe the slide you want in a natural-language prompt. For example:
Create a four-column product comparison table with product name, price, key features, and target audience. Use a clean design with readable text and highlight the best-value option.
You can also upload supported files, including Word documents, PDFs, PowerPoint presentations, Excel spreadsheets, CSV files, and images. AiPPT Agent can analyze the material and use it to generate presentation slides.
To get started with AiPPT Agent:
Step 1. Enter your prompt or upload a relevant file.

Step 2. Review the generated presentation and request changes through chat.

Step 3. Refine individual slides in the editor and export your finished presentation in a supported format.

While AiPPT Agent can help you create or redesign table-based slides, it is not a replacement for spreadsheet software. Review important figures and make sure the generated table communicates your information accurately.
Kesimpulan
A good table should help your audience understand a comparison or dataset quickly, even from a distance.
Now that you know how to make a table in PowerPoint, you should also remember that there is no need to display every figure if a smaller set can communicate the point more clearly.
Start by reviewing an existing table and removing unnecessary details. You can also use AiPPT Agent to create a clearer table-based slide quickly.
FAQs About PowerPoint Tables
Here are answers to common questions about creating, editing, and formatting tables in PowerPoint.
1. How do I add rows or columns to a PowerPoint table?
To add more rows or columns to an existing table in PowerPoint:
- Select a cell near where you want the new row or column.
- Open the Table Layout tab.
- Choose Insert Above, Insert Below, Insert Left, or Insert Right in the Rows & Columns tab.
- To remove one, select it and choose Delete.
2. Can I insert an Excel table into PowerPoint?
Yes, you can. Here is how to insert a table into PowerPoint from an Excel spreadsheet:
- Open your Excel workbook and select the cells you want to use.
- Click Ctrl + A to select the entire table in the sheet.
- Press Ctrl + C to copy.
- Open your PowerPoint slide and press Ctrl + V to paste.
- You can keep the source formatting, match the presentation theme, or embed the Excel worksheet.
3. How do I make a PowerPoint table look professional?
To make your PowerPoint table look more professional:
- Start by removing unnecessary borders and applying a consistent color scheme.
- Make the header row stand out and align text consistently.
- Adjust cell margins to create enough breathing room.
- Keep the wording concise and use a readable font size.
- Finally, highlight only the most important values.
- Preview the slide in presentation mode to check that the table remains clear from a distance.