For researchers, teams & leaders

Survey Results Presentation Templates for Clearer Findings

Create a stakeholder-ready survey results presentation in minutes. Start from a proven research structure, then customize response rates, audience segments, charts, key findings, and recommendations.Create a survey findings deck in minutes. Customize response data, charts, insights, and recommendations with AI.
Browse Templates
Customer feedbackEmployee surveysMarket research
Corporate Business Report for Annual Reviews
Findings-first slide flow
AI-assisted survey copy
Editable research templates
Export to PowerPoint

Related survey research resources

How to create a survey results presentation

  1. Define the audience, decision, and research question the presentation must address.
  2. Clean the response data, verify the sample size, and identify meaningful segments.
  3. Use AI or a survey results template to organize the story around the strongest findings.
  4. Match each finding to a readable chart and add a plain-language interpretation.
  5. Review labels, context, and confidentiality before exporting the final PowerPoint deck.

Example sections in your survey results presentation

  • Survey objective, audience, sample size, and field dates
  • Executive summary of the most decision-relevant findings
  • Response distributions and comparisons by audience segment
  • Open-ended themes supported by short representative comments
  • Conclusions, recommendations, owners, and next steps

Choose your survey results presentation format

Customer Satisfaction Survey Results

Applicable to:

NPS reviewsService feedbackProduct experience

Summarize satisfaction scores, loyalty drivers, pain points, and prioritized customer experience improvements.

Employee Engagement Survey Findings

Applicable to:

Annual engagementPulse surveysCulture reviews

Compare engagement themes across teams while protecting confidentiality and connecting insights to workplace actions.

Market Research Survey Analysis

Applicable to:

Buyer researchBrand trackingConcept testing

Present respondent profiles, preferences, market demand, segment differences, and implications for strategy.

Academic Survey Results Report

Applicable to:

Student researchThesis studiesProgram evaluation

Explain methodology, sample characteristics, quantitative findings, qualitative themes, limitations, and evidence-based conclusions.

Example survey results presentation

What makes a survey results presentation effective

  • State the survey objective, response base, field dates, and audience before interpreting results.
  • Lead with the few findings that answer the decision question and explain why they matter.
  • Match chart types to response formats and label percentages, scales, and segment bases directly.
  • End with evidence-linked recommendations, owners, timing, and questions that still need investigation.

Common mistakes

  • Showing every survey question instead of prioritizing the findings stakeholders need to act on.
  • Using pie charts for too many categories or comparisons that are easier to read as bars.
  • Hiding small sample sizes, missing responses, question wording, or important methodological limitations.
  • Reporting percentages without interpretation, benchmarks, segment context, or a clear recommended action.

Frequently Asked Questions

Include the survey objective, methodology, sample profile, response rate, key findings, segment comparisons, qualitative themes, conclusions, and recommended actions. Put detailed question-level tables in an appendix when they are not essential to the main story.
Start with the decision the audience needs to make, then select only the findings that inform it. Use direct chart labels, plain-language takeaway titles, and one interpretation or action beside each important visual.
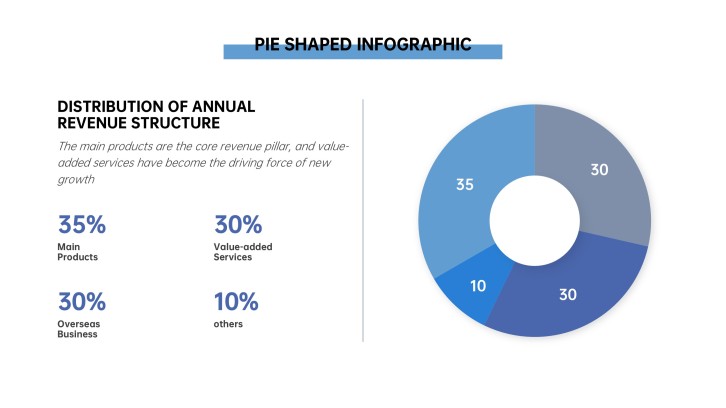
Use bars for comparing categories, stacked or diverging bars for Likert scales, and simple pies only for a few parts of a whole. Use line charts for repeated surveys over time and theme summaries or selected comments for open-ended answers.
A practical structure is cover, executive summary, survey objective and method, respondent profile, key findings, segment comparisons, open-text themes, implications, recommendations, and appendix. Adapt the length to the audience and meeting purpose.
An executive readout often works in 8-12 core slides, while a detailed research review may need more. Keep the main narrative concise and move supporting cuts, question wording, and technical details to backup slides.
AI can help organize your objective, findings, chart notes, and recommendations into a clear slide outline. With AiPPT, you can generate a starting presentation from your prompt or content, choose a template, and then verify every figure before presenting.
AI Presentation Maker

Generate your survey results presentation now

Turn your survey objective, findings, and recommendations into a structured presentation with AI.