For marketers, agencies & teams

Social Media Report Presentation Templates for Clear Results

Create a stakeholder-ready social media report presentation in minutes. Start from a proven reporting structure, then customize KPIs, channel performance, audience insights, top content, and next steps.Create a social media report in minutes. Customize KPIs, channel results, insights, and next steps with AI.

Browse Templates
Monthly reportingChannel analyticsCampaign results
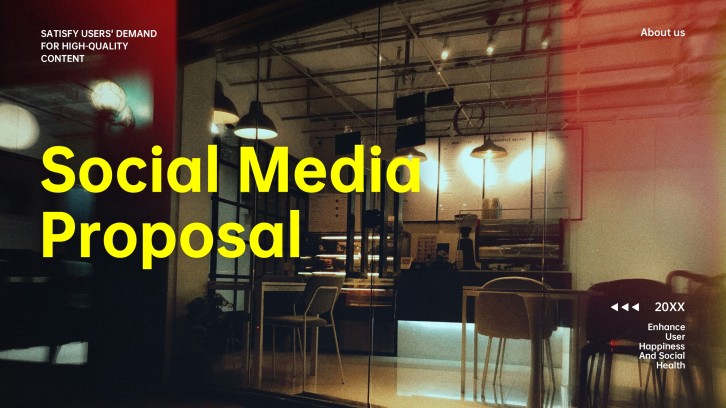
Social Media Marketing Action Plan PPT
Report-ready slide flow
AI-assisted insight copy
Editable analytics templates
Export to PowerPoint

Related social media reporting resources

How to create a social media report presentation

  1. Define the reporting period, audience, goals, and decision questions.
  2. Gather consistent KPI data from every relevant social channel.
  3. Generate a report outline with AI or choose a template.
  4. Add charts, comparisons, top content, insights, and recommendations.
  5. Verify calculations, simplify labels, and export the final deck.

Example sections in your social media report presentation

  • Executive performance summary
  • KPI and goal scorecard
  • Channel-by-channel results
  • Top content and audience insights
  • Recommendations and next actions

Choose your social media report presentation format

Monthly Social Media Performance Report

Applicable to:

Marketing teamsAgency clientsLeadership reviews

Summarize monthly KPIs, channel movement, standout content, lessons, and priorities for the next reporting cycle.

Weekly Social Media Results Update

Applicable to:

Campaign standupsContent teamsGrowth meetings

Create a concise weekly update covering output, reach, engagement, wins, blockers, and immediate actions.

Cross-Channel Social Media Analytics Report

Applicable to:

Brand teamsMulti-platform campaignsQuarterly reviews

Compare platform performance, audience behavior, content efficiency, and conversion contribution in one analytical deck.

Social Media Campaign Results Presentation

Applicable to:

Product launchesPaid campaignsEvent promotion

Report campaign objectives, delivery, creative performance, budget efficiency, outcomes, and recommendations for future activity.

Example social media report presentation

What makes a social media report presentation effective

  • KPIs connect directly to campaign and business goals.
  • Every comparison uses the same period and metric definition.
  • Charts lead to a clear insight, implication, or decision.
  • Recommendations name an action, owner, and expected result.

Common mistakes

  • Reporting vanity metrics without explaining business relevance.
  • Mixing organic and paid results without clear labels.
  • Filling slides with platform screenshots instead of conclusions.
  • Presenting percentage changes without baselines or sample sizes.

Frequently Asked Questions

Include an executive summary, goals, core KPIs, channel comparisons, audience insights, top content, paid results, lessons, and next actions. Keep each slide focused on a decision or takeaway.
Most stakeholder reports work well in 8-15 slides. A weekly update can be shorter, while a monthly or quarterly report may need channel detail and appendices.
Choose metrics that match the stated goal, such as reach, engagement rate, video completion, clicks, leads, conversions, cost per result, or attributed revenue. Define each KPI consistently across periods.
Lead with the takeaway, show one relevant chart, and explain why the change happened. Add a benchmark or prior-period comparison so the audience can interpret the number.
A weekly report emphasizes delivery, immediate wins, issues, and near-term actions. A monthly report has enough data for trend analysis, channel comparisons, content learnings, and strategic recommendations.
AI can help generate a structured presentation from your goals, reporting period, metrics, and findings. With AiPPT, start from a prompt or template, then replace example figures with verified platform data.
AI Presentation Maker

Generate your social media report presentation now

Turn your KPIs, channel results, insights, and next actions into a clear presentation with AI.