For sales, finance & leadership

Sales Forecast Presentation for Clear Revenue Decisions

Create a leadership-ready sales forecast presentation in minutes. Start from a proven structure for sales and finance teams, then customize revenue projections, pipeline assumptions, quotas, forecast scenarios, and next steps.Create a sales forecast deck in minutes. Customize projections, pipeline assumptions, quotas, and scenarios with AI.
Browse Templates
Monthly forecastsQuarterly projectionsAnnual planning
Sales Forecast PPT for Sales Teams
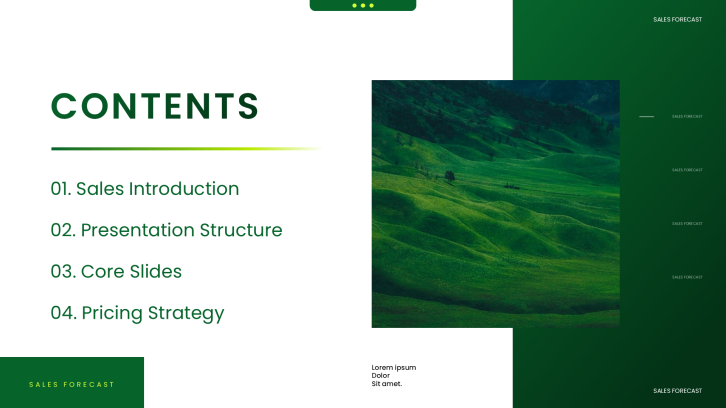
Forecast-ready slide flow
AI-assisted sales copy
Editable sales templates
Export to PowerPoint

Related sales forecast presentation resources

How to create a sales forecast presentation

  1. Define the forecast period, decision audience, revenue target, and level of detail required.
  2. Gather historical sales, current pipeline, win rates, deal timing, seasonality, and rep inputs.
  3. Generate a first draft with AI or choose a sales forecast presentation template.
  4. Replace sample data with monthly, quarterly, or annual projections and document key assumptions.
  5. Review totals and scenarios with finance, then refine the story and export the final deck.

Example sections in your sales forecast presentation

  • Executive forecast summary with target, commit, best case, and gap
  • Historical sales trend and baseline performance
  • Pipeline coverage, stage conversion, and expected close timing
  • Monthly, quarterly, or annual revenue projection by segment
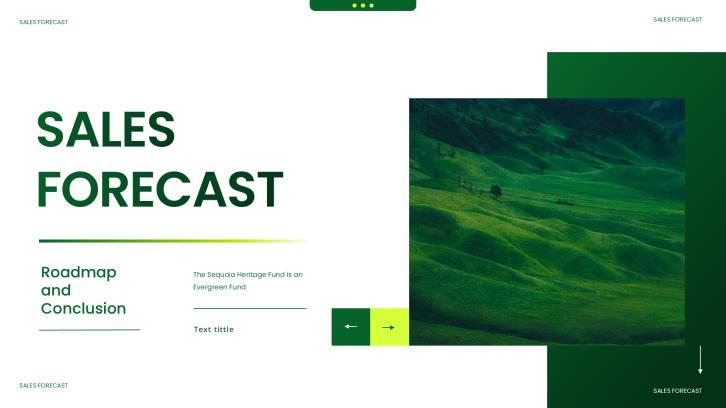
  • Risks, forecast scenarios, actions, owners, and next review date

Choose your sales forecast presentation format

Monthly Sales Forecast Presentation

Applicable to:

Sales managersRevenue operationsWeekly pipeline reviews

Track near-term bookings, deal movement, quota gaps, and actions for the coming month.

Quarterly Sales Forecast Presentation

Applicable to:

Executive reviewsRegional leadersBoard updates

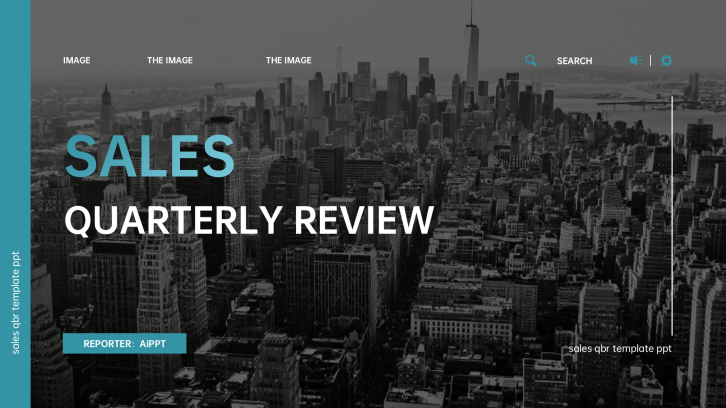
Compare quarterly targets, forecast categories, pipeline coverage, scenarios, and leadership decisions.

Annual Sales Projection Presentation

Applicable to:

Strategic planningFinance teamsTerritory design

Present annual revenue projections by period, product, market, and growth assumption.

Scenario-Based Sales Forecast Deck

Applicable to:

Risk planningInvestor updatesCapacity decisions

Show conservative, expected, and upside outcomes with assumptions, triggers, and response plans.

Example sales forecast presentation

What makes a sales forecast presentation effective

  • Reconcile every chart and scenario to one clearly dated source dataset.
  • Separate commit, expected, and upside outcomes with explicit assumptions and confidence levels.
  • Connect projected revenue to pipeline stage, conversion rate, timing, product, region, or owner.
  • End with specific decisions, gap-closing actions, accountable owners, and review dates.

Common mistakes

  • Presenting a single revenue number without a range, assumptions, or confidence explanation.
  • Mixing bookings, recognized revenue, ARR, and pipeline value without clear definitions.
  • Hiding unfavorable variance behind crowded charts or unsupported management judgment.
  • Listing forecast risks without triggers, mitigation actions, owners, or measurable follow-up.

Frequently Asked Questions

Include an executive summary, historical baseline, pipeline coverage, forecast methodology, period-by-period projections, scenarios, risks, and next actions. Clearly label the data cutoff and every major assumption.
Most leadership reviews work well with 8 to 15 core slides. Use fewer slides for a monthly update and more when quarterly or annual planning requires product, region, and scenario detail.
A forecast usually reflects the most likely outcome based on current pipeline and evidence. A projection can model a broader future outcome based on stated assumptions, even when the supporting opportunities are not yet in the pipeline.
Keep the same definitions and scenario logic across time horizons. Show monthly detail for near-term execution, quarterly totals for management decisions, and annual trends for capacity and strategic planning.
Use lines for trends, columns for period comparisons, waterfalls for target gaps, funnels for pipeline conversion, and tables for major deals. Every chart should show units, dates, and the applicable scenario.
AI can turn your goals, assumptions, and source content into a structured first draft. With AiPPT, choose a relevant template or generate a deck, then replace sample figures and verify every calculation before presenting.
AI Presentation Maker

Generate your sales forecast presentation now

Turn your sales data, forecast assumptions, and leadership priorities into a clear presentation with AI.