For leaders, sales & operations

Quarterly Business Review Presentation Template + AI Generator

Create a leadership-ready quarterly business review presentation in minutes. Start from a proven QBR structure, then customize KPIs, financial results, customer insights, risks, lessons, and next-quarter priorities.Create a polished QBR deck in minutes. Customize KPIs, insights, risks, and next-quarter priorities with AI.
Browse Templates
Executive reviewsSales performanceQuarterly planning
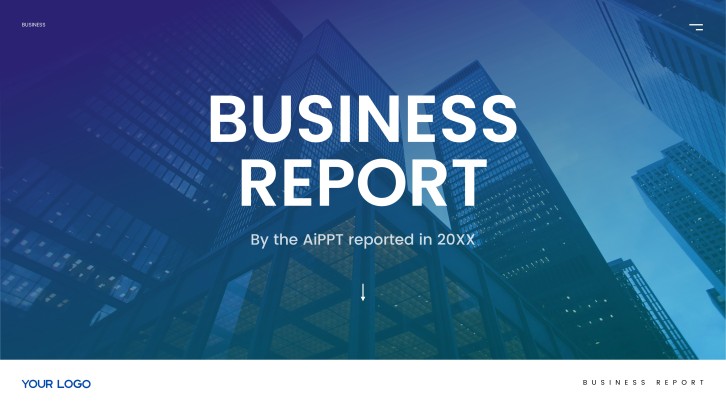
Company Quarterly Business Review PPT
QBR-ready slide flow
AI-assisted review copy
Editable business templates
Export to PowerPoint

Related quarterly business review resources

How to create a quarterly business review presentation

  1. Define the audience, decisions needed, and quarter being reviewed.
  2. Gather KPI results, targets, trends, wins, risks, and supporting evidence.
  3. Generate a QBR presentation with AI or choose a relevant template.
  4. Customize charts, commentary, priorities, owners, and next-quarter milestones.
  5. Verify every number, rehearse the narrative, and export the final deck.

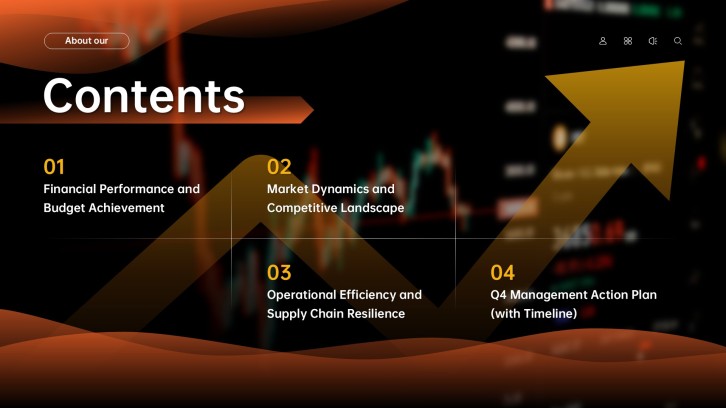
Example sections in your quarterly business review presentation

  • Executive summary and quarterly scorecard
  • Financial and operational performance
  • Customer, market, and competitive insights
  • Challenges, root causes, and lessons
  • Next-quarter priorities, owners, and timeline

Choose your quarterly business review presentation format

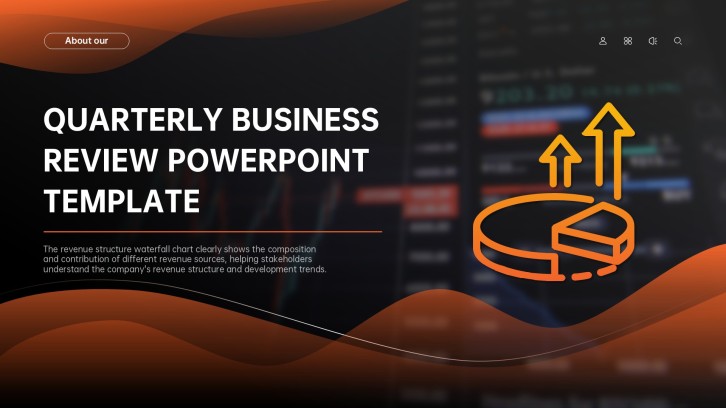
Executive Quarterly Business Review Presentation

Applicable to:

Leadership teamsBoard updatesBusiness units

Summarize enterprise KPIs, strategic outcomes, risks, decisions, and next-quarter priorities for senior leaders.

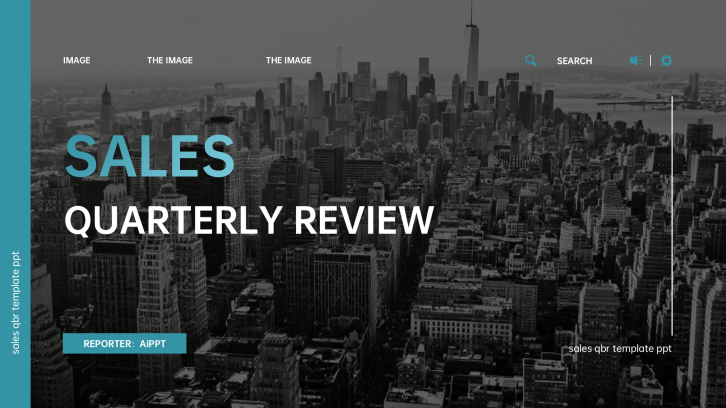
Sales QBR Presentation

Applicable to:

Sales teamsRegional leadersRevenue operations

Review quota attainment, pipeline health, segment performance, deal risks, and the next-quarter sales plan.

Customer Success QBR Deck

Applicable to:

Key accountsCustomer successRenewal meetings

Connect adoption, outcomes, support trends, renewal health, and shared goals in a customer-facing QBR.

Operations Quarterly Review Presentation

Applicable to:

Operations teamsSupply chainProject offices

Explain capacity, efficiency, delivery, quality, constraints, and funded actions for the coming quarter.

Example quarterly business review presentation

What makes a quarterly business review presentation effective

  • Opens with a decision-focused executive summary and consistent KPI scorecard.
  • Compares actuals with targets, prior quarters, and clearly defined benchmarks.
  • Explains causes and implications instead of presenting isolated charts and numbers.
  • Ends with prioritized actions, accountable owners, dates, and measurable outcomes.

Common mistakes

  • Filling slides with operational detail that does not affect leadership decisions.
  • Mixing metric definitions or reporting periods across teams and business units.
  • Hiding misses behind averages without quantifying gaps and root causes.
  • Listing next steps without owners, deadlines, resources, or success measures.

Frequently Asked Questions

Include an executive summary, KPI scorecard, financial and operational results, customer or market insights, major wins, risks, root causes, and next-quarter actions. Every action should have an owner, timing, and success measure.
Use a decision-first structure: summary, performance versus goals, segment insights, wins, misses and causes, lessons, and next-quarter priorities. Put detailed supporting data after the main narrative or in an appendix.
Most leadership QBR decks work well at 10 to 20 core slides, depending on the business scope and meeting length. Keep one main message per slide and reserve time for discussion.
Connect metrics to business goals, explain why results changed, and identify decisions leadership must make. Separate informative updates from issues that require action, resources, or tradeoffs.
AI can turn your quarter, audience, KPIs, results, challenges, and priorities into a structured first draft. With AiPPT, you can start from a prompt or template, then verify the data and tailor the narrative.
A useful example shows actual versus target, explains the largest variance, highlights repeatable wins, and ends with a funded action plan. Use realistic figures and consistent comparisons so stakeholders can follow the logic.
AI Presentation Maker

Generate your quarterly business review presentation now

Turn your KPIs, results, insights, and next-quarter priorities into a structured QBR presentation with AI.