For leaders, teams & stakeholders

Financial Report Presentation Template + AI Generator

Create a stakeholder-ready financial report presentation in minutes. Start from a proven business structure, then customize financial results, strategic milestones, market insights, operational highlights, and next-year priorities.Create a financial report deck in minutes. Customize results, milestones, insights, and priorities with AI.
Browse Templates
Board updatesInvestor reportingCompany performance
Corporate Business Report for Annual Reviews
Financial reporting slide flow
AI-assisted report copy
Editable business templates
Export to PowerPoint

Related financial report presentation resources

How to create a financial report presentation

  1. Define the reporting period, audience, and decisions the deck must support.
  2. Gather audited results, operating metrics, milestones, risks, and strategic context.
  3. Generate a financial report PPT outline with AI or select a template.
  4. Replace sample content with consistent charts, commentary, and brand visuals.
  5. Verify every figure, simplify key messages, rehearse, and export the final deck.

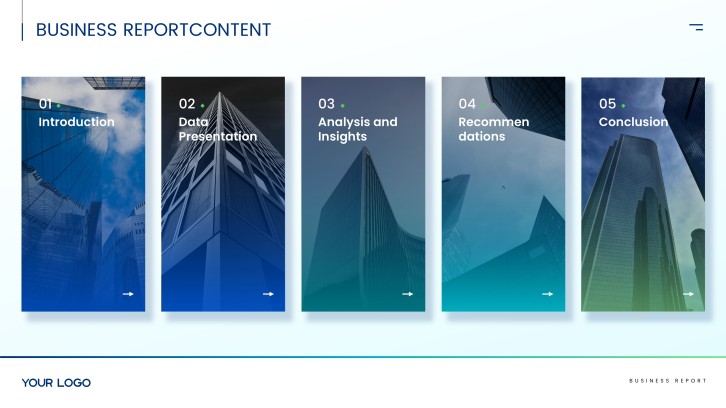
Example sections in your financial report presentation

  • Executive summary and year highlights
  • Financial and operating performance
  • Customer, product, and market progress
  • Risks, lessons, and strategic responses
  • Next-year priorities and outlook

Choose your financial report presentation format

Board Annual Performance Review Presentation

Applicable to:

Board meetingsExecutive reviewsGovernance updates

Generate a decision-focused deck combining headline results, strategic progress, material risks, and next-year priorities.

Investor Annual Results Presentation

Applicable to:

Investor updatesShareholder meetingsEarnings reviews

Create an evidence-led financial report PowerPoint centered on financial performance, growth drivers, outlook, and shareholder context.

Nonprofit Annual Impact Report Presentation

Applicable to:

Donor briefingsCommunity updatesGrant reporting

Turn program outcomes, beneficiary stories, funding use, and future goals into an accessible impact narrative.

Department Year-in-Review Presentation

Applicable to:

Team all-handsLeadership planningBudget reviews

Summarize a department's achievements, KPI trends, resource use, lessons learned, and coming-year plan.

Example financial report presentation

What makes a financial report presentation effective

  • Opens with a clear executive summary tied to the reporting period.
  • Shows comparable, sourced metrics with concise explanations of material variance.
  • Connects financial results to customer, product, market, and operational drivers.
  • Ends with specific priorities, owners, measures, and decisions for the coming year.

Common mistakes

  • Copying dense report paragraphs onto slides instead of prioritizing key messages.
  • Mixing reporting periods, units, or chart scales without explaining the differences.
  • Celebrating isolated wins while omitting misses, risks, and lessons learned.
  • Presenting next-year aspirations without targets, timelines, or accountable owners.

Frequently Asked Questions

Include an executive summary, financial and operating results, major achievements, customer or market insights, material risks, and next-year priorities. Add sources and brief commentary so stakeholders can understand why results changed.
Most leadership or stakeholder decks work well at 10 to 20 slides, depending on reporting complexity. Keep the core narrative concise and move detailed tables or supporting analyses to an appendix.
Extract the decisions, headline metrics, major variances, and outlook from the report before designing slides. Use one key message per slide, then support it with a chart, short evidence, and a clear takeaway.
A useful example connects objectives to results, explains performance drivers, and ends with measurable next steps. It also uses consistent periods, definitions, and visual scales so comparisons remain trustworthy.
Yes. An AI financial report presentation generator can help structure your outline and turn supplied content into a first-draft deck. Review every figure, claim, and forecast against approved source material before presenting.
Choose a template with layouts for an executive summary, KPI charts, milestones, analysis, risks, and outlook. The design should fit your brand while keeping numerical comparisons and annotations easy to read.
AI Presentation Maker

Generate your financial report presentation now

Use AI to structure your results, insights, and priorities into a polished financial report presentation faster.