For students, science fairs & analytics projects

Data Science Project Presentation Template + AI Generator

Create a clear data science project presentation in minutes. Start from a research-ready structure for datasets, methods, charts, findings, and conclusions.Create data science project slides fast. Turn datasets, methods, charts, and findings into a clear presentation with AI.

Browse Templates
Data science project decksScience fair presentationsResearch report slides
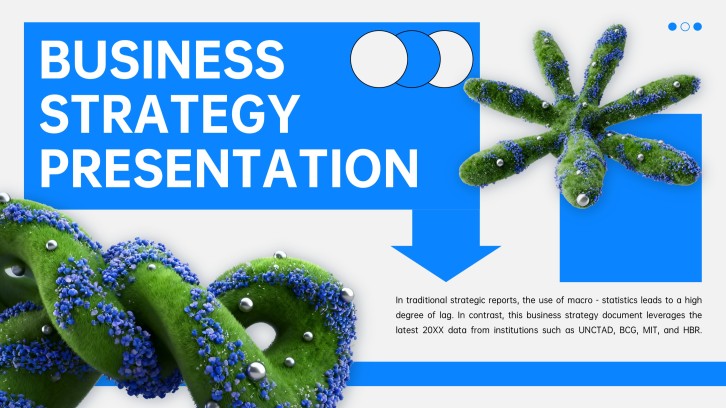
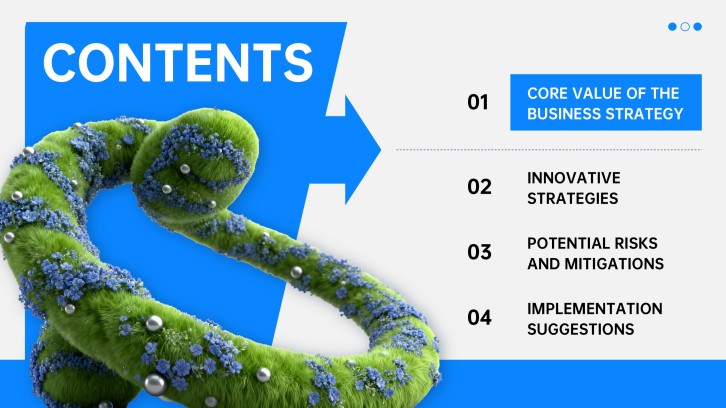
Free Blue Tech Style Computer Science Presentation Template
Data project slide flow
AI-assisted analysis copy
Editable research templates
Export to PowerPoint

Related data science project resources

How to create a data science project presentation

  1. Define the research question, audience, and project goal before choosing charts or slides.
  2. Introduce the dataset, key variables, data source, and any important limits or assumptions.
  3. Show your method clearly, including cleaning steps, analysis workflow, tools, and model choice.
  4. Turn results into visual evidence with labelled charts, concise insights, and plain-language interpretation.
  5. Close with conclusions, limitations, recommendations, and next steps for improving the project.

Example sections in your data science project presentation

  • Project title, research question, and hypothesis
  • Dataset overview, variables, and data cleaning notes
  • Exploratory charts, trends, and summary statistics
  • Model, analysis method, results, and interpretation
  • Conclusion, limitations, recommendations, and Q&A

Choose your data science project presentation format

Student Data Science Project Presentation

Applicable to:

Middle school projectsHigh school data unitsCollege intro courses

Best for explaining a classroom dataset, research question, charts, and findings in a student-friendly structure.

Science Fair Data Analysis Presentation

Applicable to:

Science fair boardsSTEM competitionsResearch poster sessions

Use this format to connect your experiment or investigation to evidence, visuals, and a clear conclusion.

Machine Learning Project Presentation

Applicable to:

AI courseworkCapstone projectsPortfolio reviews

Ideal for presenting problem framing, features, model choice, evaluation metrics, limitations, and next improvements.

Business Data Science Case Study

Applicable to:

Analytics teamsBusiness classesInternship presentations

Best for turning messy data, business context, key metrics, and recommendations into an executive-ready story.

Example data science project presentation

What makes a data science project presentation effective

  • Start with a specific research question the audience can understand quickly.
  • Explain the dataset, variables, and assumptions before showing results.
  • Use charts that make one insight clear instead of decorating every slide with data.
  • Connect every finding to a conclusion, limitation, or recommended next step.

Common mistakes

  • Showing charts without explaining what the audience should notice.
  • Skipping data cleaning, missing values, or assumptions that affect trust.
  • Using technical model terms without a plain-language explanation.
  • Claiming the analysis proves more than the dataset can actually support.

Frequently Asked Questions

A data science project presentation should usually include the problem or research question, dataset overview, data cleaning process, methodology, exploratory analysis, model or analytical approach, key results, visualizations, limitations, conclusions, and recommended next steps. Keep the presentation focused on how your analysis answers the original question rather than showing every technical step.
A clear structure is: project overview, problem statement, dataset and variables, data preparation, methodology, exploratory data analysis, model or analysis results, interpretation, limitations, conclusion, and Q&A. For business-focused projects, add a slide explaining the practical impact or recommendations based on your findings.
For a short classroom, portfolio, or interview presentation, around 8–15 slides is usually enough. Longer academic or capstone projects may need more slides to explain the dataset, methodology, model evaluation, and limitations. The best slide count depends on the presentation time and the technical level of your audience.
Choose charts that directly support your findings. Bar charts work well for category comparisons, line charts for trends over time, scatter plots for relationships, histograms for distributions, and confusion matrices or ROC curves for some machine learning projects. Avoid adding visualizations that do not help explain a specific insight.
Start with the problem and dataset, then explain important features, preprocessing steps, model selection, evaluation metrics, and results. Compare models when relevant and explain why the final model was selected. Include limitations and possible improvements instead of focusing only on accuracy or other performance scores.
Focus first on the problem, the main insight, and why the result matters. Use simple charts, reduce technical terminology, and translate model metrics into practical meaning. Technical details such as algorithms, feature engineering, or validation methods can be summarized briefly or moved to supporting slides when the audience does not need them.
Yes. A data science project presentation template can be adapted for college assignments, capstone projects, research presentations, science fairs, machine learning projects, portfolio presentations, and analytics case studies. You can adjust the amount of methodology and technical detail depending on your course requirements and audience.
Yes. You can use AiPPT to turn your project information into a structured presentation and then customize the slides for your dataset, methodology, charts, results, and conclusions. Review generated content carefully and replace example data or visuals with the actual evidence from your project before presenting.
AI Presentation Maker

Generate your data science project presentation now

Create a data science project presentation with AI, then customize your dataset, analysis workflow, charts, findings, and conclusion for class, science fair, or portfolio use.