For teams, teachers & analysts

Comparison Chart PPT Templates for Clearer Decisions

Create a decision-ready comparison chart PPT in minutes. Start from an editable structure for products, vendors, plans, or concepts, then customize criteria, evidence, scores, and recommendations.Create a comparison chart PPT in minutes. Customize options, criteria, scores, and recommendations with AI.
Browse Templates
Product comparisonsVendor evaluationsBefore and after
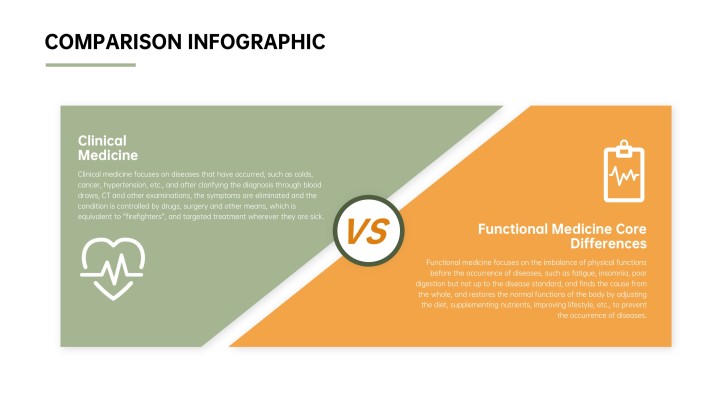
Side by Side Comparison Infographic Templates
Comparison-ready slide flow
AI-assisted chart copy
Editable comparison templates
Export to PowerPoint

Related comparison chart presentation resources

How to create a comparison chart PPT

  1. Define the decision, audience, and options you need to compare.
  2. Choose shared criteria and gather evidence for every option.
  3. Generate a comparison structure with AI or select a template.
  4. Align rows, labels, scales, colors, and supporting annotations.
  5. Verify the data, emphasize the takeaway, and export to PowerPoint.

Example sections in your comparison chart PPT

  • Comparison question and decision context
  • Options and evaluation criteria
  • Side-by-side feature matrix
  • Weighted scores and evidence
  • Recommendation and next steps

Choose your comparison chart PPT format

SaaS Product Feature Comparison Presentation

Applicable to:

Software buyersProduct teamsSales enablement

Compare capabilities, integrations, pricing, support, and fit across competing software products.

Vendor Evaluation Scorecard Presentation

Applicable to:

Procurement reviewsAgency selectionPartner evaluation

Turn weighted requirements, vendor evidence, risk ratings, and scores into a transparent recommendation.

Before-and-After Performance Comparison

Applicable to:

Project reviewsProcess improvementCampaign reporting

Show baseline and current performance with matching metrics, visual changes, and concise takeaways.

Education Concept Comparison Chart

Applicable to:

Classroom lessonsStudy guidesResearch summaries

Explain similarities, differences, definitions, examples, and evidence for two related concepts.

Example comparison chart PPT

What makes a comparison chart PPT effective

  • Every option is judged against the same clearly labeled criteria.
  • Numbers use consistent units, time periods, scales, and reliable sources.
  • Color and icons guide attention without replacing essential labels.
  • The final takeaway explains the best fit and important tradeoffs.

Common mistakes

  • Comparing unequal features or using missing data as if it were zero.
  • Packing too many options and criteria into one unreadable slide.
  • Highlighting a winner before explaining weights, evidence, or assumptions.
  • Mixing decorative charts that do not support the actual comparison question.

Frequently Asked Questions

A comparison chart PPT is a PowerPoint deck or slide that places options against shared criteria. It helps an audience see similarities, differences, strengths, weaknesses, and tradeoffs before making a decision.
Define the options and shared criteria first. Then use a comparison layout, table, bar chart, or side-by-side shapes; keep rows aligned, label every value, and emphasize the main conclusion.
Use a table for detailed features, bars for numeric values, a Venn diagram for overlap, and side-by-side cards for concise qualitative differences. Choose the format that makes the decision easiest to understand.
Two to four options usually fit comfortably on one slide. If you have more, show a summary first and move detailed criteria to additional slides so labels remain readable.
PowerPoint and Google Slides both support common comparison structures such as tables, shapes, charts, and side-by-side cards. After opening or importing a template, check fonts, spacing, icons, and chart formatting before presenting.
AI can help organize your topic into options, criteria, evidence, and a logical slide sequence. With AiPPT, start from a prompt or content, choose a suitable template, and then verify every score and claim yourself.
AI Presentation Maker

Generate your comparison chart PPT now

Turn your options, criteria, and evidence into a clear comparison presentation with AI.